Figure 4.

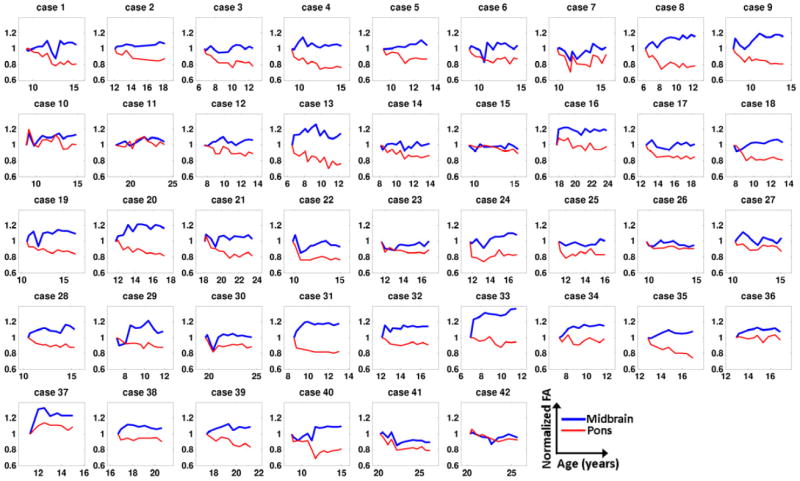
Temporal plots of FA in CST and dTPF for all 42 patients. Each FA value was normalized by the corresponding baseline value.

Temporal plots of FA in CST and dTPF for all 42 patients. Each FA value was normalized by the corresponding baseline value.