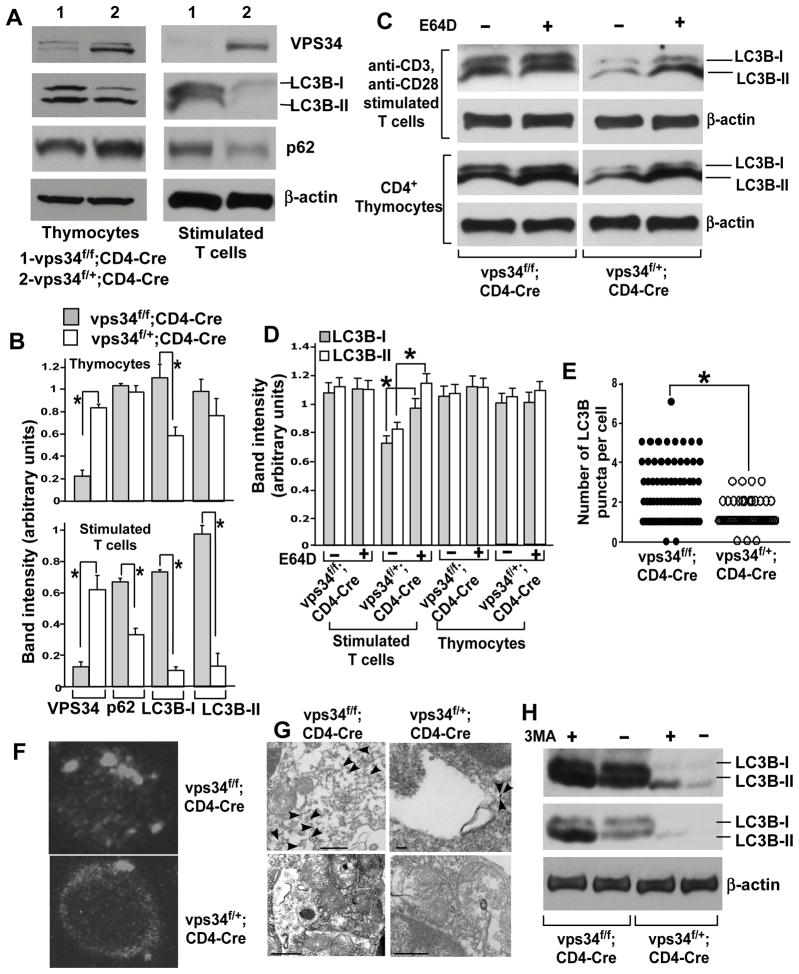
FIGURE 1.
Vps34-deficient T cells display defective autophagy. (A) CD4+ thymocytes or total T cells were purified from 6- to 8-week-old Vps34f/f;CD4-Cre or Vps34f/+;CD4-Cre mice using magnetic sorting. Proteins were prepared from CD4+ thymocytes or from anti-CD3/CD28 stimulated T cells for immunoblot analysis with antibodies against Vps34, p62, LC3B or β-actin. Representative data from three independent experiments are shown. (B) Densitometric analysis of protein bands obtained in (A). Data are from an average of 4 mice from 3 independent experiments. *p<0.05. (C) Autophagic flux assay was performed by culture of CD4+ thymocytes or activated T cells in the absence or presence of E64D (10 μg/ml) plus pepstatin A (10 μg/ml) for 90 min, followed by immunoblot analysis with the anti-LC3B antibody. (D) Densitometric analysis of protein bands obtained in (C). Data are from an average of 4 mice from 3 independent experiments. *p<0.05. (E) Purified total T cells were stained with the anti-LC3B and Cy3-labeled donkey anti-mouse antibodies. Z-stack images were captured and spaced at 1 μm using confocal microscopy and a total of 30–35 cells in each group were analyzed. The number of LC3 punctae was quantified at a threshold set at pixels >4. *p<0.05. (F) A representative image from (E) is shown. (G) Activated T cells were stained with anti-LC3B antibodies followed by anti-rabbit antibodies labeled with 10 nm gold particles. The cells were embedded, sectioned and stained with uranyl acetate and lead citrate followed by analysis with a Philips/FEI T-12 transmission electron microscope. Note the predominant staining of LC3B associated with autophagosomes (staining indicated with arrows) in Vps34f/+;CD4-Cre T cells (scale bar=100nm) (upper panel), while increased cytosolic staining is observed in Vps34f/f;CD4-Cre T cells (scale bar=500nm) (upper panel). Controls with secondary antibody alone rarely showed gold staining in T cells from either Vps34f/f;CD4-Cre or Vps34f/+;CD4-Cre mice (scale bar=500nm) (lower panel). Note in the control image of T cells derived from Vps34f/f;CD4-Cre mice that cellular organelles accumulate and are clumped together due to defective autophagy. (H) T cells were enriched and activated as in (A). The cells were treated with 3-MA (5 mM) for the last 5 hours of culture, followed by immunoblot analysis with anti-LC3B antibody. Blots with high (upper panel) or low (lower panel) exposure time are shown. The data are representative of 3 independent experiments with similar results.

