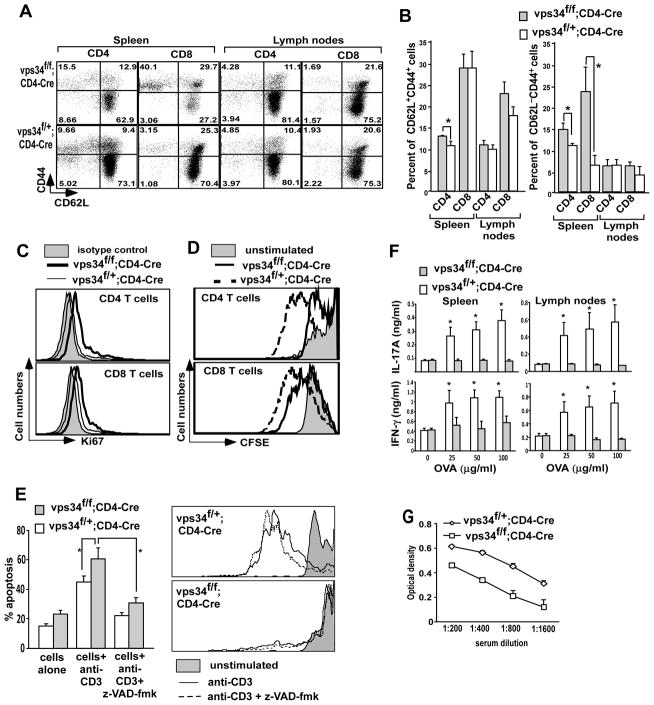
FIGURE 5.
Homeostatic markers and proliferation of T cells in response to TCR engagement. (A) Splenocytes and lymph node cells derived from Vps34f/f;CD4-Cre or Vps34f/+;CD4-Cre mice were stained with anti-CD44, -CD62L, -CD4 and -CD8 antibodies. The data shown are gated on CD4+ or CD8+ T cells. (B) Summary of results obtained in (A). The average ± SEM of 6 mice is shown. (C) Splenocytes were stained with anti-CD4-PerCP and -CD8-APC antibodies followed by intracellular staining with anti-Ki67 antibody. The data shown are gated on CD4+ or CD8+ T cells. A representative experiment of 3 individual experiments is shown. (D) Splenocytes from Vps34f/f;CD4-Cre or Vps34f/+;CD4-Cremice were labeled with the CFSE dye and 3×10⁵ cells/well were activated with anti-CD3 antibody (1 μg/ml) for 60 hrs. Cells were stained with anti-CD4 and -CD8 antibodies and CFSE dilution analysis was performed on the respective T cell subset. (E) CFSE-labeled cells were cultured as in (D) with or without z-VAD-fmk (20 μM). The percentage total apoptotic cells was measured (left) as described in the legend of Fig. 4 and CFSE dilution analysis was performed on CD4+ T cells. A representative experiment of 3 individual experiments is shown. (F) Vps34f/f;CD4-Cre or Vps34f/+;CD4-Cre mice were immunized with ovalbumin (OVA). The mice were sacrificed at day 15 and splenic and draining lymph node cells were stimulated in vitro with 100 μg/ml of OVA. The supernatants were collected at 72 hrs of culture and assayed for IL-17A and IFN-γ by ELISA. (G) Total serum IgG derived from Vps34f/f;CD4-Cre or Vps34f/+;CD4-Cre mice was measured by ELISA. The average ± SEM of 4 mice is shown.

