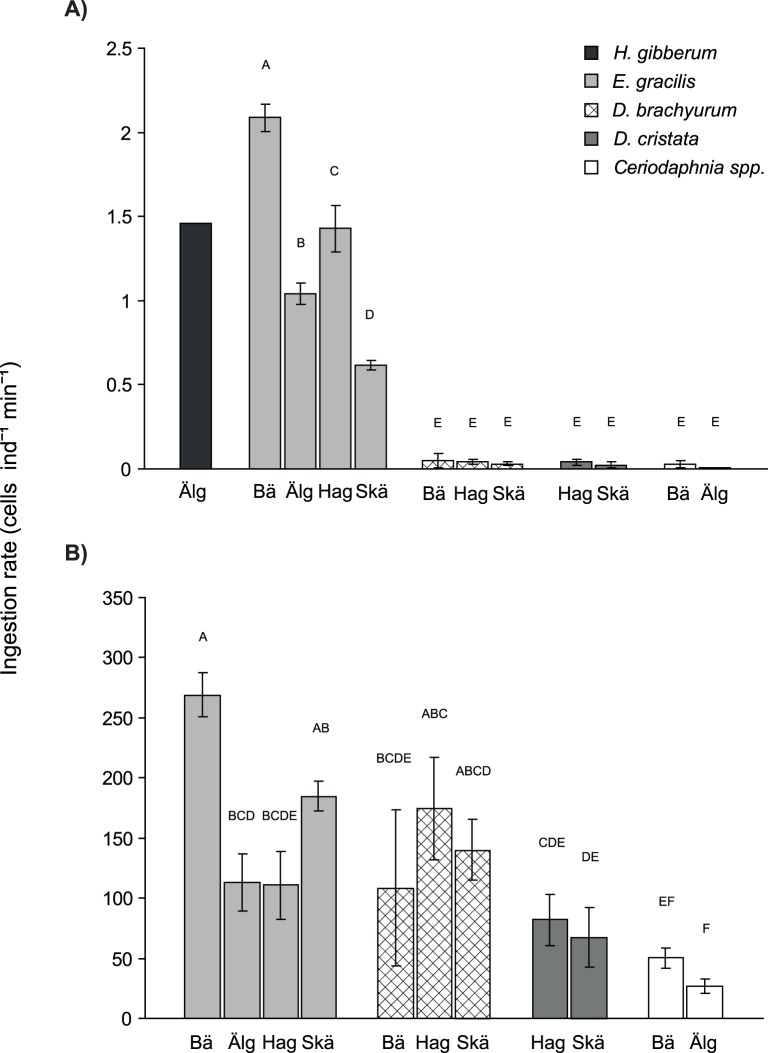
Figure 1. Ingestion rates.
Ingestion rates (cells ind−1 min−1) of zooplankton from the four different lakes feeding on A) G. semen and B) P. subcapitata. Lakes Bäen and Älgarydssjön have a history of recurring G. semen blooms whereas Hagasjön and St Skärsjön usually have low biomasses of G. semen. Bars not connected by the same letter are significantly different from each other (one way ANOVA with Tukey’s HSD comparisons, p<0.05). The H. gibberum sample comprised only one replicate and was not included in the statistical analysis. Error bars represent standard deviation.

