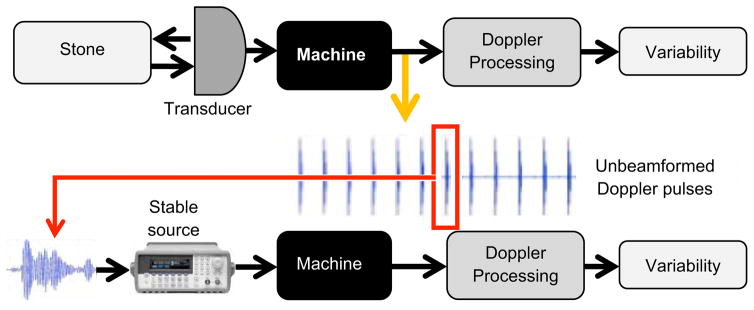
Figure 1.

Diagram of the experimental setup and procedure. The upper part shows the flow chart of RF data acquisition. The RF data for unbeamformed Doppler ensemble that corresponds to the TA was recorded. The variability was examined based on the Doppler power estimation by using self-developed signals and Doppler processing algorithms. One pulse within multiple pulses was picked randomly and interpolated in the frequency domain. The function generator (lower part) was connected to the machine directly and triggered by the same trigger signal used in the VUE. The interpolated chosen Doppler pulse was programmed into the function generator. Simulated stable Doppler signals were sent back to the machine and then the same signal and Doppler processing algorithms were employed. Doppler power was calculated for identifying whether there is variability within the Doppler ensemble.
