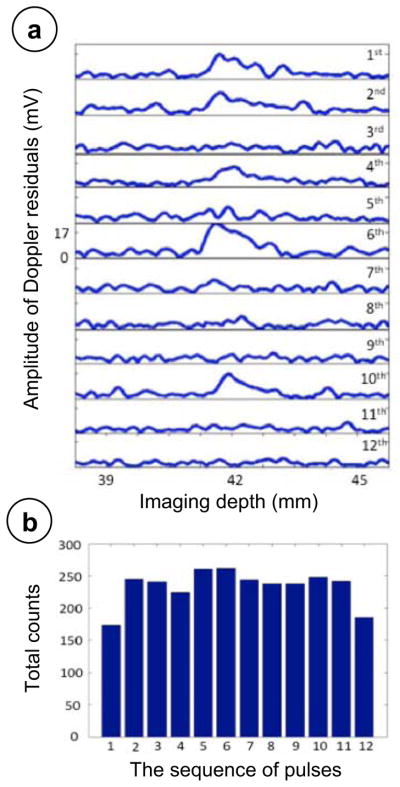
Figure 4.

a) The amplitude varies among 12 Doppler wall-filter filtered pulses (from top to the bottom, 1st pulse to 12th pulse). The 1st, 2nd, 6th, and 10th pulse showed larger amplitude than any other pulses within the Doppler residuals. The x-axis is the imaging depth in mm; the y-axis is the amplitude of the Doppler residuals in millivolts. b) The total counts of abnormal events happened among 12 Doppler wall-filtered pulses in stone phantom imaging cases that showed the twinkling artifact. The x-axis is the sequence of the pulses within the Doppler ensemble. The y-axis is the count of the abnormal events happened.
