
Figure 8.
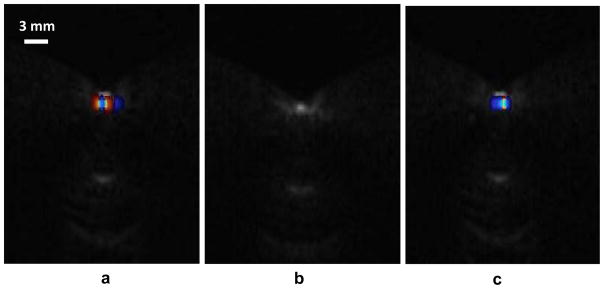
Results of the TA on acrylic spheres with rough surfaces immerged in different liquids. The TA on the sphere immerged in water (a), ethanol (b), and water again (c). The results are similar to results shown in Fig. 7. The TA was suppressed under ethanol. This figure is available in movie form in supplement 2.