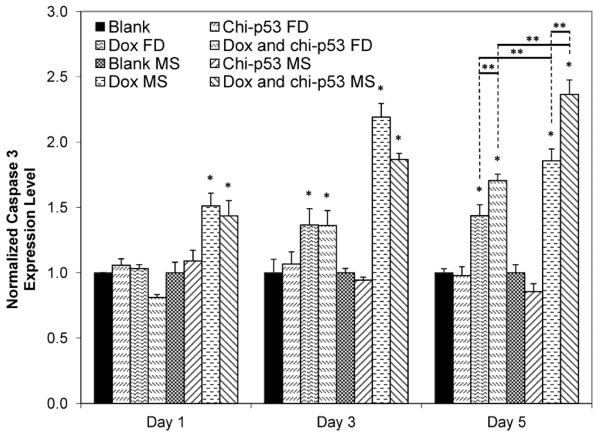
Figure 9.
Expression of caspase 3 in HepG2 cells at one, three and five days after commencement of treatment. The groups include blank and free drug (FD) groups (blank, chi-p53 FD, Dox FD, and combined Dox and chi-p53 FD) as well as blank and drug loaded microsphere (MS) groups (blank MS, chi-p53 MS, Dox MS, and combined Dox and chi-p53 MS). The free drug groups represent equivalent amount(s) of Dox (0.9 μg/ml) and/or chi-p53 (1 μg DNA) released from the drug loaded microsphere groups after five days determined from in vitro release profiles. The absorbance values were normalized to cell number, followed by normalizing to the respective control groups. Data represent mean ± standard deviation, n = 3. Statistical significance (*p < 0.05) was determined by one-way ANOVA analysis as compared to the control group, while (**p < 0.05) was determined by Student’s t-test comparison between the two samples.

