
Figure 1. Illustration of the MULTSEG problem.
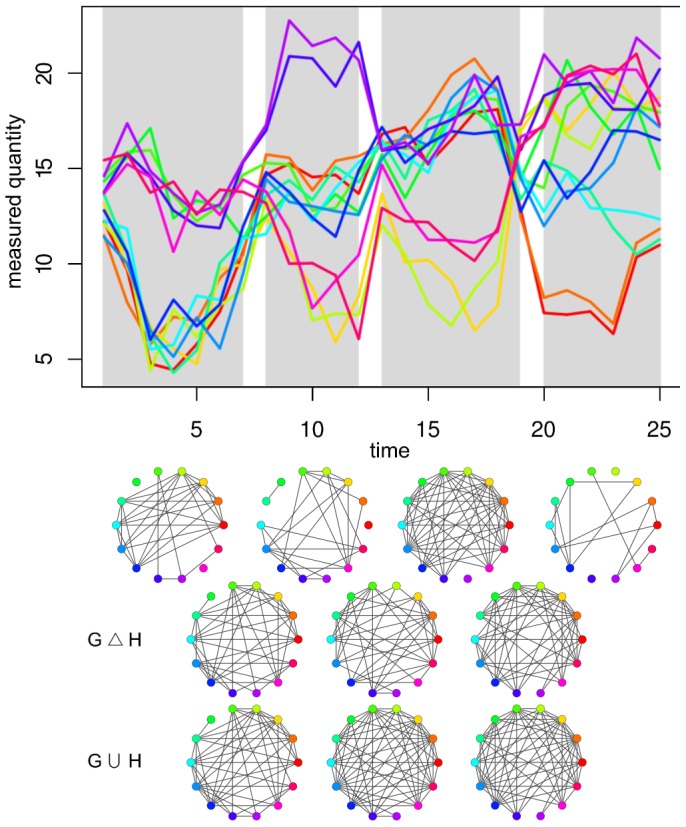
(Upper panel) 14 time series over 25 time points; (Middle panel) Networks reconstructed from the shown series. The networks correspond to the 4 optimal time series segments, depicted with light grey rectangles in the upper panel. The color coding of nodes correspond to the colors of the time series; (Lower panel, the last two rows) Symmetric difference and union networks from the consecutive segments resulting in the optimal value of 2.40 for the objective  , with relative density as a distance measure.