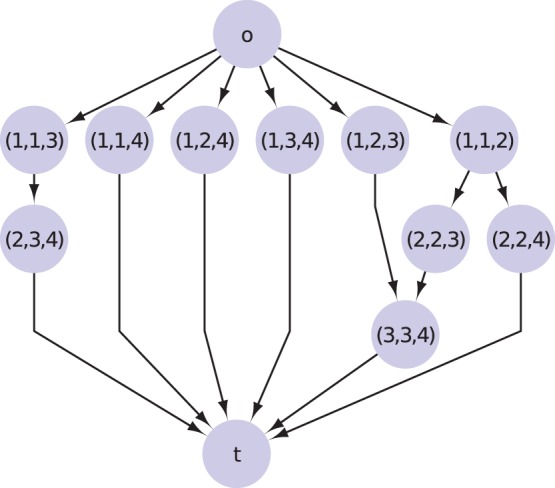
Figure 2. Directed acyclic graph (DAG) used as input in Algorithm 1 (Fig. 3).

The DAG  for
for  time points is depicted. It contains
  nodes, including the special nodes
  and
and  . The label
  of each node corresponds to the time points
  ,
,  , and
, and  .
.

The DAG  for
for  time points is depicted. It contains
  nodes, including the special nodes
  and
and  . The label
  of each node corresponds to the time points
  ,
,  , and
, and  .
.