
Figure 4. Illustration of the segmentation for synthetic data with relative density as network property.
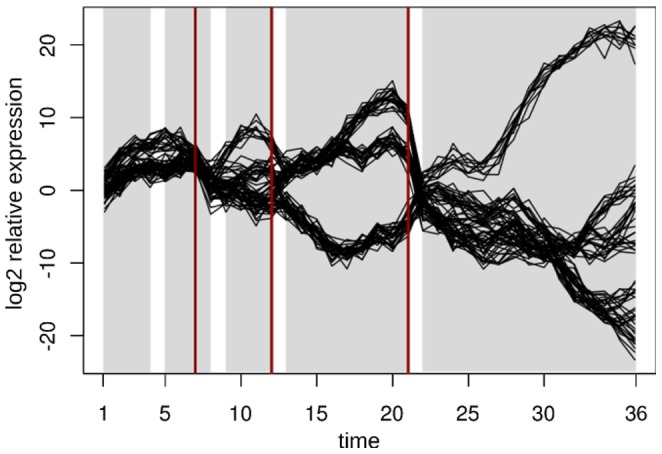
The resulting partitions are highlighted in light grey and the simulated segmentation points are marked with red bars.
Official websites use .gov
A
.gov website belongs to an official
government organization in the United States.
Secure .gov websites use HTTPS
A lock (
) or https:// means you've safely
connected to the .gov website. Share sensitive
information only on official, secure websites.
The resulting partitions are highlighted in light grey and the simulated segmentation points are marked with red bars.