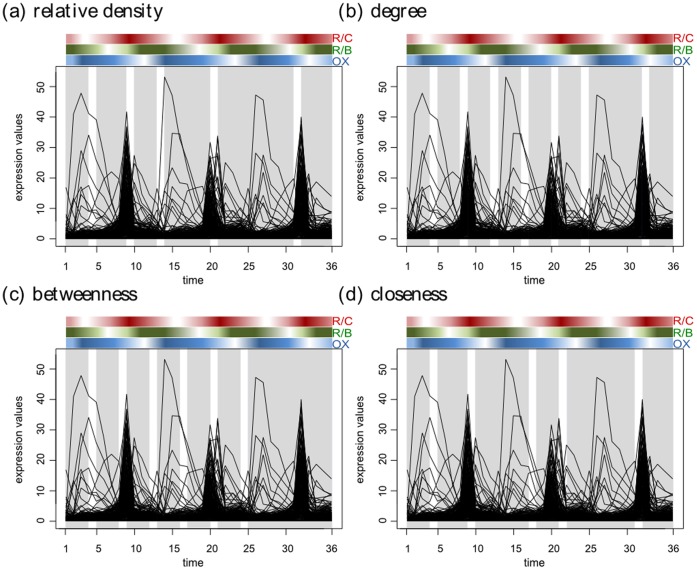
Figure 5. Segmentation for yeast’s metabolic cycle.
The partitions found by applying our method are highlighted in light grey. The phases of the yeast metabolic cycle are indicated with colored rectangles above each panel following Tu et al. [36]. R/C stands for reductive charging, OX oxidative metabolism, and R/B, reductive metabolism. (a) shows the segmentations caught by relative density as global property; (b) illustrates the segmentations based on degree; (c) and (d) demonstrate segmentations with local-global properties, betweenness and closeness, respectively. The segmentations in panel (a) performs particularly well due to the global changes in the form of global cycles in the data set from yeast.

