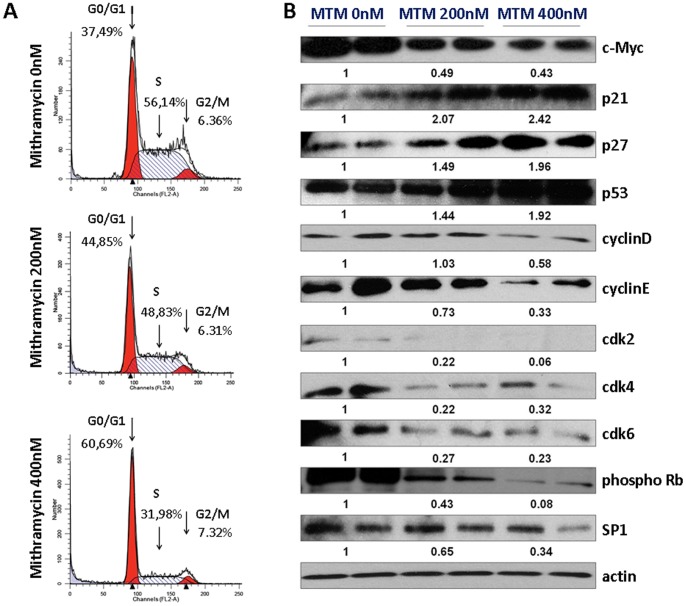
Figure 2. MTM induces a dose-dependent increase of the percentage of cells in G0/G1 phase.
A Cell cycle analysis of 5TGM1 cells treated with 0, 200 or 400 nM of MTM. Cells were treated for 24 h with 200 nM and 400 nM of MTM and DNA was stained with propidium iodide, followed by flow cytometry analysis. This treatment resulted in a dose-dependent increase of the percentage of cells in G0/G1 phase (45% and 61%, respectively) when compared to the untreated cells (37%) (p<0,01). A decreased percentage of cells in the S phase was also observed (56% versus 49% and 32% for the 200 nM and 400 nM conditions, respectively) (p<0,01). Percentages of cells in G1, S or G2 phases following MTM treatment are indicated on the graph. B Protein expression of c-Myc, p21, p27, p53, cyclin D/CDK4 and cyclin E/CDK2, cdk6, phospho Rb and SP1 analyzed by Western blot (duplicates, repeated 3 times). Protein loadings were normalized with β-actin. Data shown are representative of at least three independent experiments. We observed an upregulation of p53, an inhibition of c-myc, while SP-1 remained stable. Downstream, p21 and p27 were upregulated, while cyclin B, cyclin E, CDK2, CDK4, CDK6 were decreased, which finally resulted in decreased phosphorlyation of Rb.

