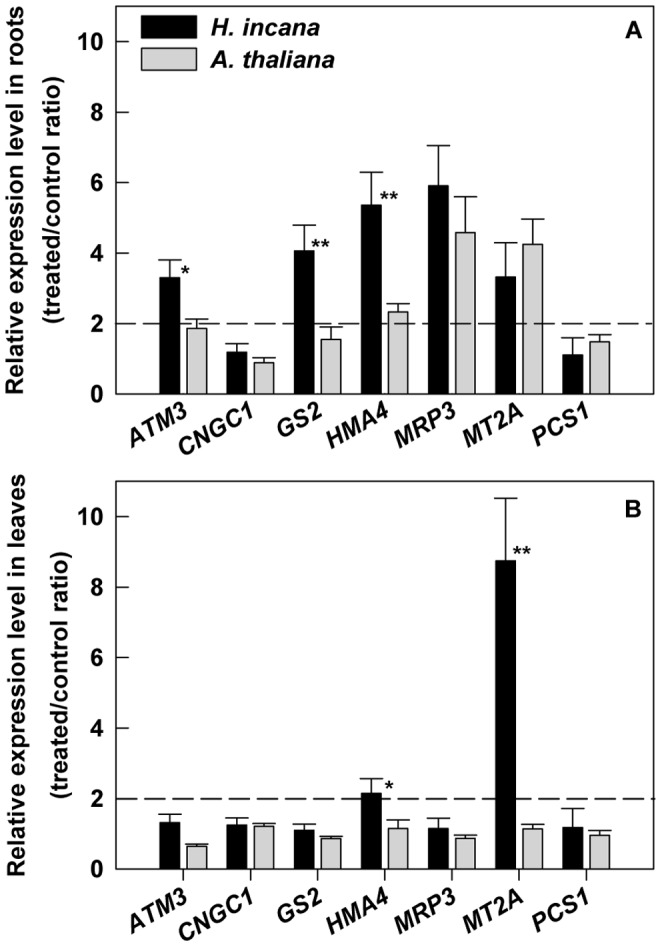
Figure 5. Quantitative analysis of the expression levels of ATM3, CNGC1, GS2, HMA4, MRP3, MT2a and PCS1 genes.

Expression profiles were obtained from (A) roots and (B) leaves of H. incana and A. thaliana, Pb-treated or not for 3 days. ATM3: ATP-binding cassette transporter of mitochondrial protein, CNGC1: cyclic nucleotide-gated channel, GS2: glutathione synthetase, HMA4: heavy metal ATPase, MRP3: multidrug resistance-associated protein, MT2a: metallothionein and PCS1: phytochelatin synthase. The tubulin gene was used as reference gene and the calibration was done against the roots or the leaves of plants cultivated without Pb. Data are expressed as relative expression level (treated/control ratio) and are the average (± SE) of three independent replicates composed by nine seedlings. * and **Significant difference of values at p<0.05 and p<0.01, respectively, by Student’s t-test in comparison between H. incana and A. thaliana. Dashed line indicates a fold change of 2.
