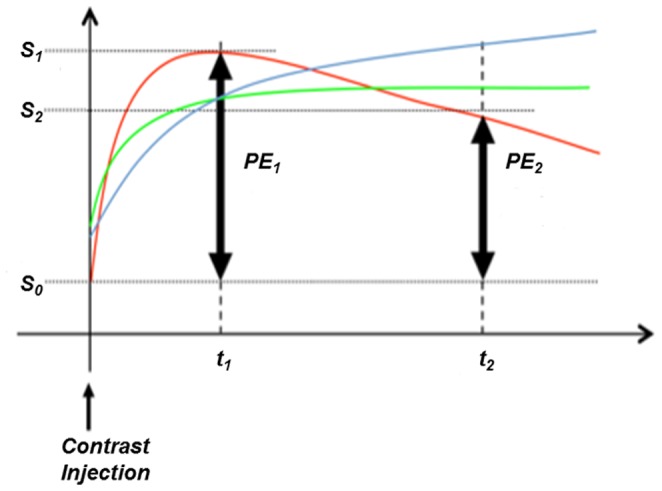
Figure 2. Signal intensity-time curve for DCE-MRI.

Signal intensity-time curve for DCE-MRI showing early (PE1) and late (PE2) percent enhancement measurements. S0, S1, and S2 represent the signal intensity of images obtained at t0 (before contrast injection), t1 (2.5 minutes after contrast injection), and t2 (7.5 minutes after contrast injection), respectively. Three curves display different patterns of signal increase and washout: 1) the blue curve shows a slow gradual increase in enhancement, more characteristic of normal tissue; 2) the green curve shows an early enhancement with little washout, essentially a plateau in signal intensity; 3) the red curve shows a pattern of early enhancement with a fast washout, which is more characteristic of highly vascularized tissues.
