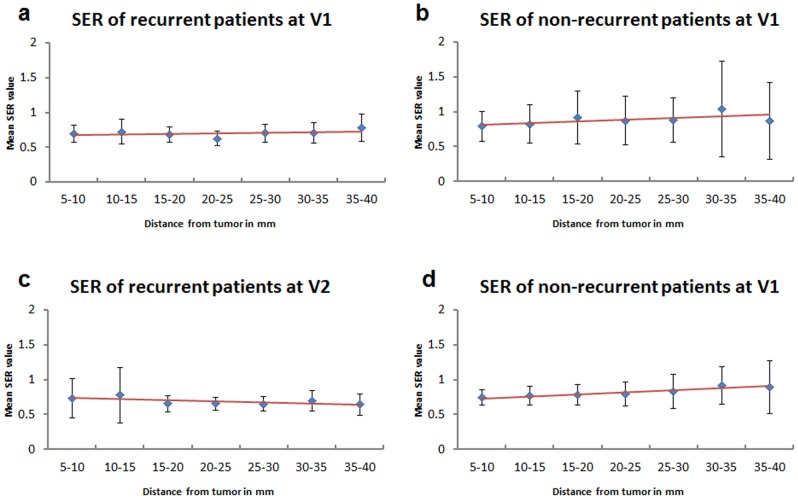
Figure 5. Stromal enhancement pattern of SER in recurrent and non-recurrent patients.
Stromal enhancement pattern of SER in recurrent and non-recurrent cohorts at V1 and V2 (based on a 5-year cut-off). The red line shows the trending of SER. At V1: there was no observable trend for recurrent group (a) but an increasing trend of stromal SER outside of tumor was observed in the non-current group (b). At V2: No observable trend was found in the recurrent group (c), but a slight increasing trend was found in the non-recurrent group (d).

