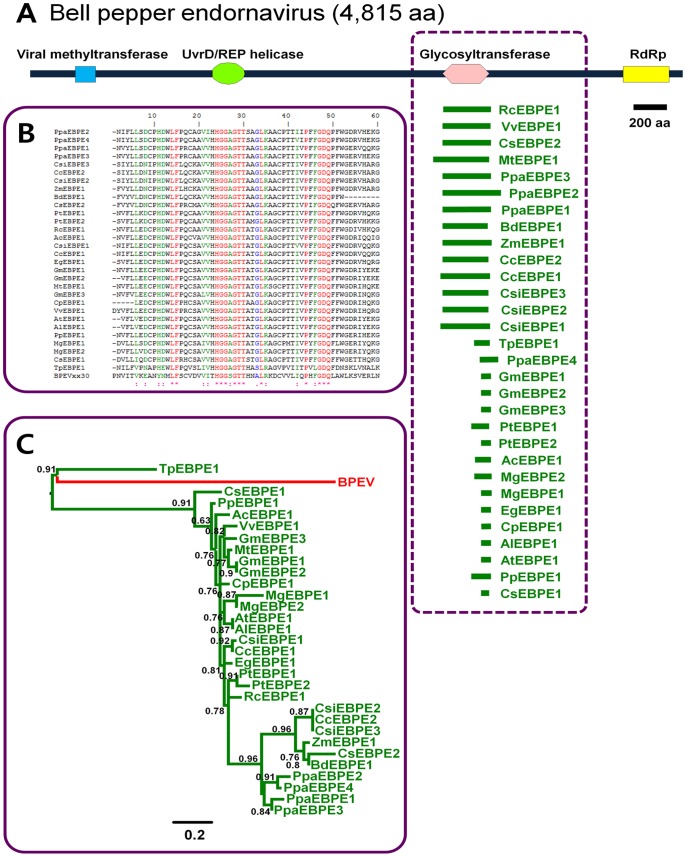
Figure 1. Identification of plant sequences homologous to BPEV.
(A) Schematic diagram of BPEV and the corresponding locations of the plant sequences homologous to BPEV. The black bar indicates the whole proteome of BPEV, and each domain of BPEV is indicated by a symbol of a different color. The small green fragments within dotted line boxes indicate the partial plant sequences homologous to BPEV with the respective names. The abbreviated protein names can be found in Table 1. (B) Amino acid alignment of the glycosyltransferase domains of BPEV and identified plant proteins using ClustalW. (C) Phylogenetic tree based on the glycosyltransferase domains of BPEV and 30 identified plant proteins constructed using the PhyML 3.0 server. The numbers on the branches are the aLRT values calculated using a SH-like method. Numbers greater than 0.5 are shown on each branch.

