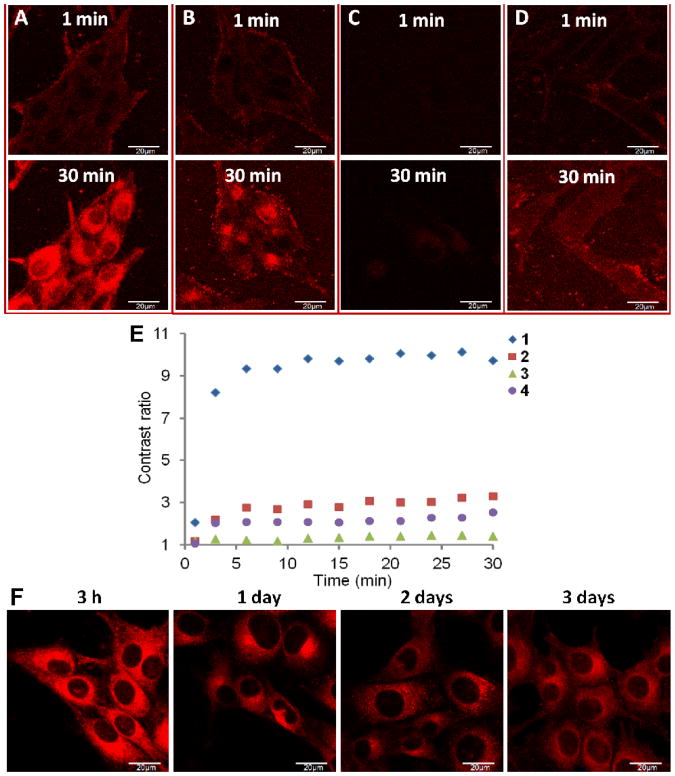
Figure 4.
A-D: Live cell imaging after adding respective dyes (A: 1, B: 2, C: 3, D: 4, final concentration: 0.1 μM) into MDA-MB-435 cells. Confocal fluorescent images taken at 1 min and 30 min after adding dyes and without washing the cells are shown. E: Cytoplasmic/extracellular fluorescent contrast ratios at different time points after adding 1-4. F: live cell images of dye 1 labeled cells after 3 h, 1, 2, and 3 days. Cells were incubated with 1 for 3 h and then washed and kept under normal conditions. All images were taken under same microscopic settings and shown with same photographic settings (see Experimental Section).

