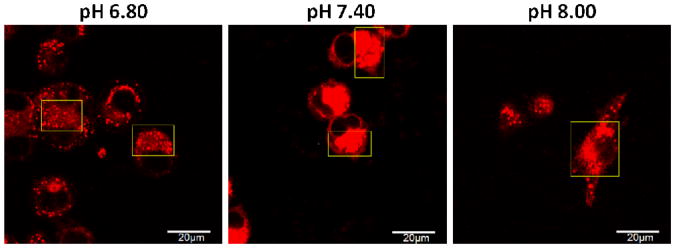
Figure 6.
Comparison of fluorescence at different intracellular pH. After incubation with 1 for 1 h, the intracellular pH of MDA-MB-435 cells was adjusted using K+-rich buffer (130 mM K+, 20 mM Na+, 0.5 mM Ca2+, 0.5 mM Mg2+ and 10 mM HEPES) in the presence of nigericin (1 μg/mL) and valinomycin (0.5 μg/mL). Live cell images were taken after 5 min.

