
Figure 1. Cardiac histology.
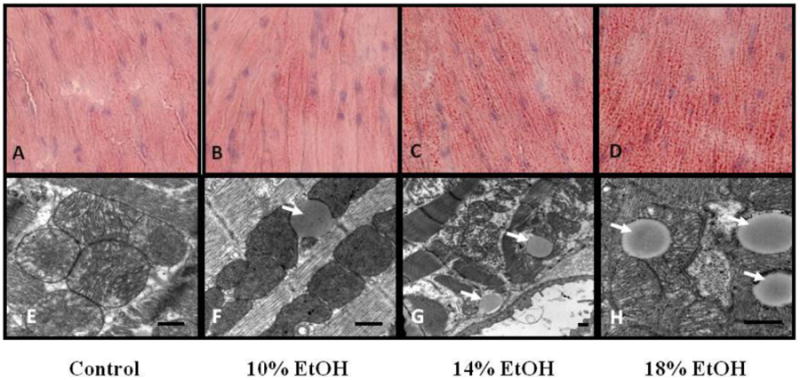
Lipid Staining Representative Oil-Red-O-(ORO-) stained sections of hearts from (A) control, (B) 10%, (C) 14% and (D) 18% EtOH-fed mice. A small number of tiny lipid droplets were seen in control hearts. Both size and number increased in all EtOH groups in dose-dependent fashion. Transmission electron microscopy. Images of (E) control, (F) 10%, (G) 14% and (H) 18% EtOH-fed mice. Lipid droplets (arrows) were clearly observed in direct contact with mitochondria in the all EtOH groups. The scale bar indicates 500nm.