
Figure 2. Echocardiographic results.
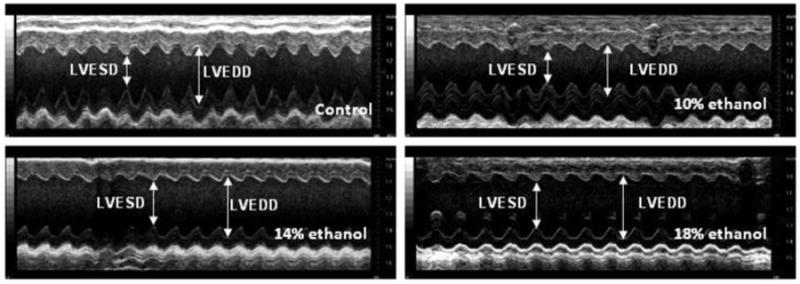
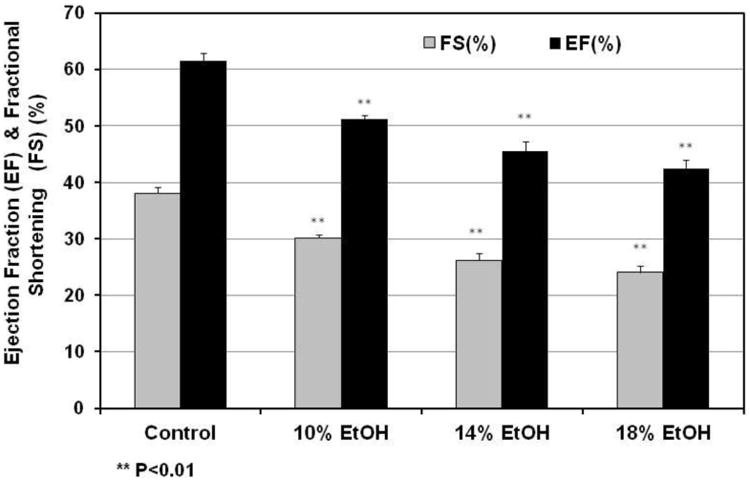
(A) M-mode image of the left ventricle in the parasternal short-axis view, showing depth markers. LVEDD: left ventricular end-diastolic diameter. LVESD: left ventricular end-systolic diameter. (B) Fractional shortening (FS) of the left ventricle between the contracted and relaxed states and ejection fraction (EF) were calculated from measurements made during the cardiac cycle. Both FS and EF were decreased progressively with increasing EtOH dose in all EtOH groups. ** p< 0.01, compared with the control group.