
Figure 3. LCFA uptake kinetics.
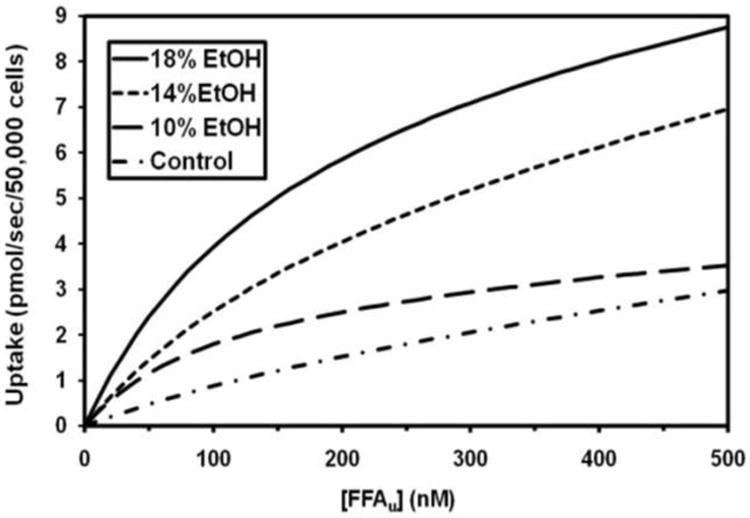
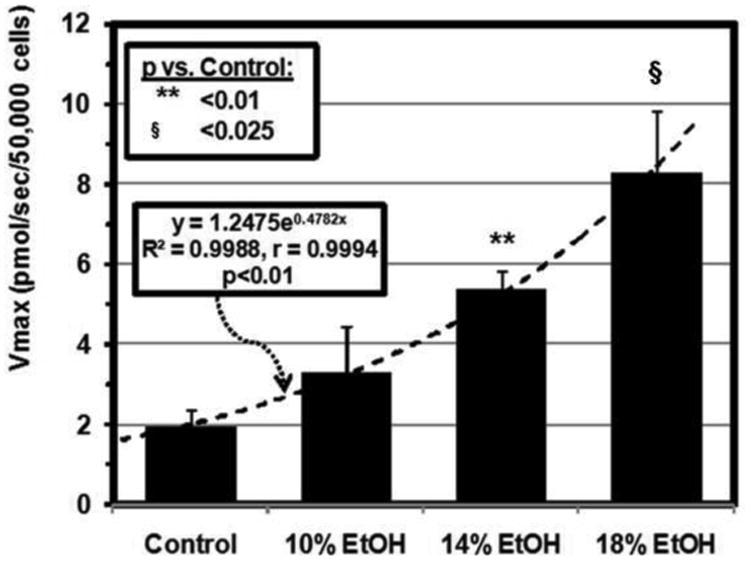
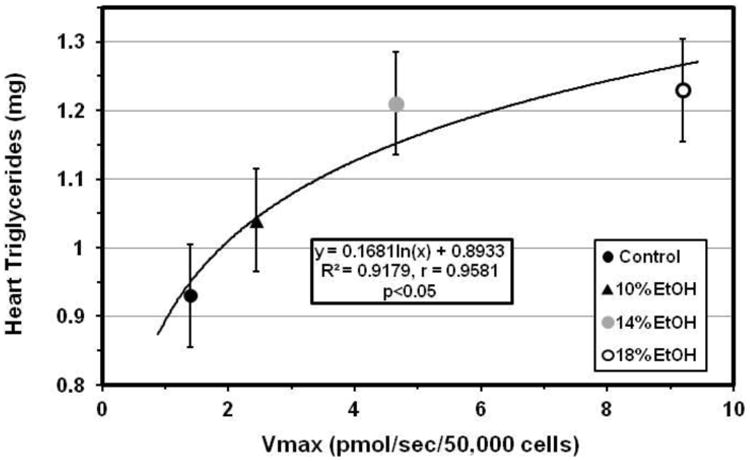
(A) [3H]-oleic acid uptake curves for cardiomyocytes from control, 10, 14 and 18% EtOH mice. Depicted are the average curves for each group, computed from group mean values for the kinetic parameters for saturable and non-saturable uptake (see text). (B) Vmax for facilitated cardiomyocyte LCFA uptake, calculated from the individual uptake curves, was increased in all EtOH groups compared with the control group. Bars represent mean ± SE. (C) Vmax was highly correlated with cardiac TG content across all groups studied.