
Figure 5. Gene expression.
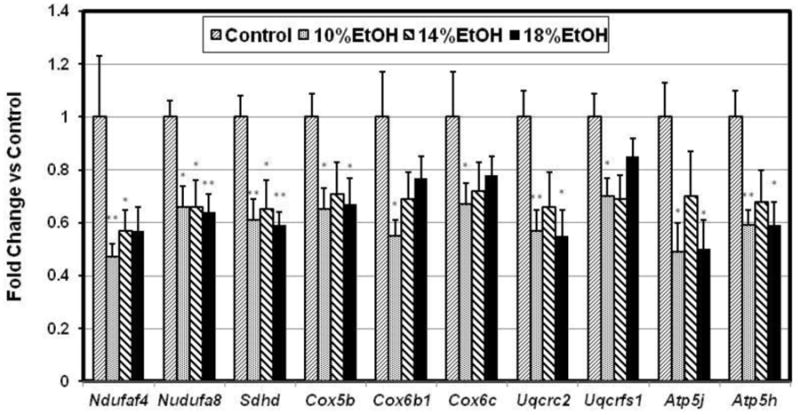
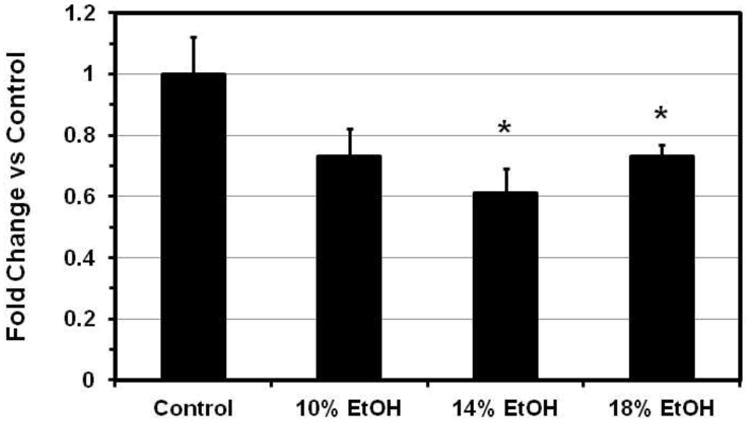
(A) Cardiac expression ratios of 10 oxidative phosphorylation genes. Complex I: NADH dehydrogenase (Ndufaf4, Ndufa8); complex II: fumaratereductase (Sdhd); complex III: cytochrome c reductase (Cox5b, Cox6b1, and Cox6c); complex IV: cytochrome c oxidase (Uqcrc2, Uqcrfs1); Complex V: F-type ATPase (Atp5j, Atp5h) were all down-regulated in all EtOH groups. Data indicate Mean ±SE. * p<0.05, ** p<0.01, compared with the control group. (B) Cardiac PGC-1α gene expression ratio. PGC-1α was significantly decreased in the 14% and 18% EtOH groups. Date presented as Mean ± SE. * p<0.05, compared with the control group.