
Figure 6. PGC-1α Gene Expression.
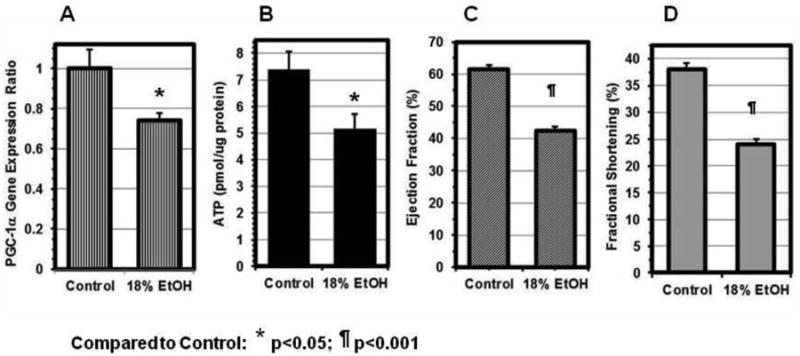
(A) The PGC-1α expression ratio in the hearts of 18% EtOH-fed mice was reduced to 74 ± 4 % of that in Controls. The extent of the decreases in the ATP content (B), EF (C) and FS (D) to 70 ± 9%, 69 ± 3%, and 63 ± 3% of their respective control values was very similar. Data are Mean ± SE. * p<0.05, ¶ p<0.001, compared with the control group.