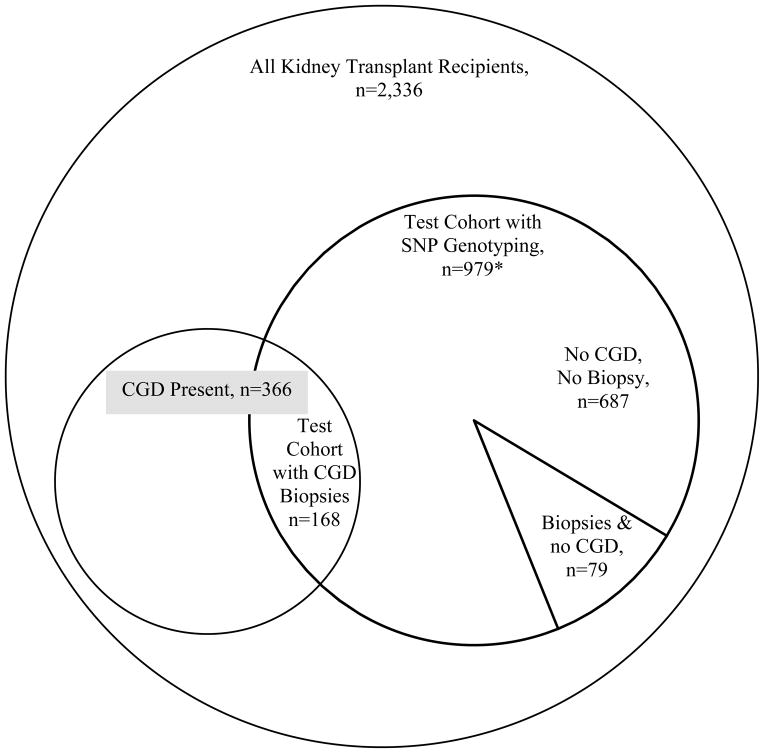
Figure 1.
A Venn-Diagram showing the sub-population of kidney transplant recipients in each analysis. All test cohort subjects with SNP genotyping were eligible for analysis of severity of tubular atrophy and interstitial fibrosis However, the analysis excluded the less than 1% (30) biopsies from 24 subjects with missing biopsy scores and excluded all 21 subjects with 3 biopsies from a single center that had no ct scores ≥2 (resulting in 687 with no biopsies, 79 with biopsies and no CGD and 168 CGD biopsies, n=934.)

