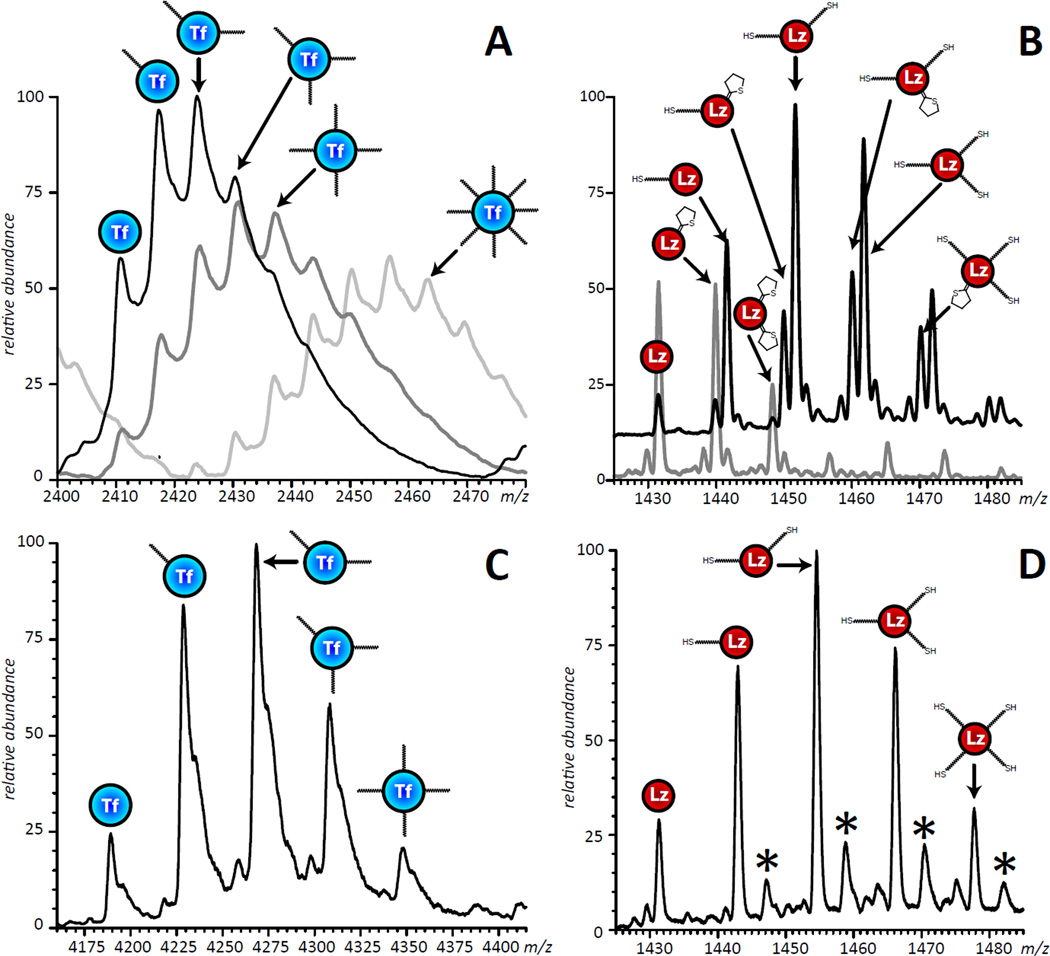
Figure 2.
ESI mass spectra of activated Tf, charge state +32 (A) and Lz, charge state +10 (B) showing a range of reactive groups attached to the surface of each protein. The three traces shown in panel A correspond to a 1:2, 1:4 and 1:20 concentration ratio of Tf to sulfo-SMCC in the reaction. The two traces shown in panel B correspond to Lz modified with Traut’s reagent for 12 hours on ice (the gray trace corresponds to the protein-to-reagent molar ratio 1:2, the product kept at room temperature for 24 hours prior to MS; and the black trace corresponds to the protein-to-reagent molar ratio 1:7, MS analysis of the product was carried out immediately upon reaction completion). The multiple peaks shown in panel B are due to the presence of both chemically active (thiols) and de-activated (rings) groups on the surface of Lz. All mass spectra were acquired under denaturing condition (10µM total protein concentration in water/methanol/acetic acid, 49:49:2 by volume). Panels (C) and (D) show Tf and Lz activated with SM(PEG)12 and SATA, respectively. The series of peaks indicated with an asterisk represent salt adducts.

