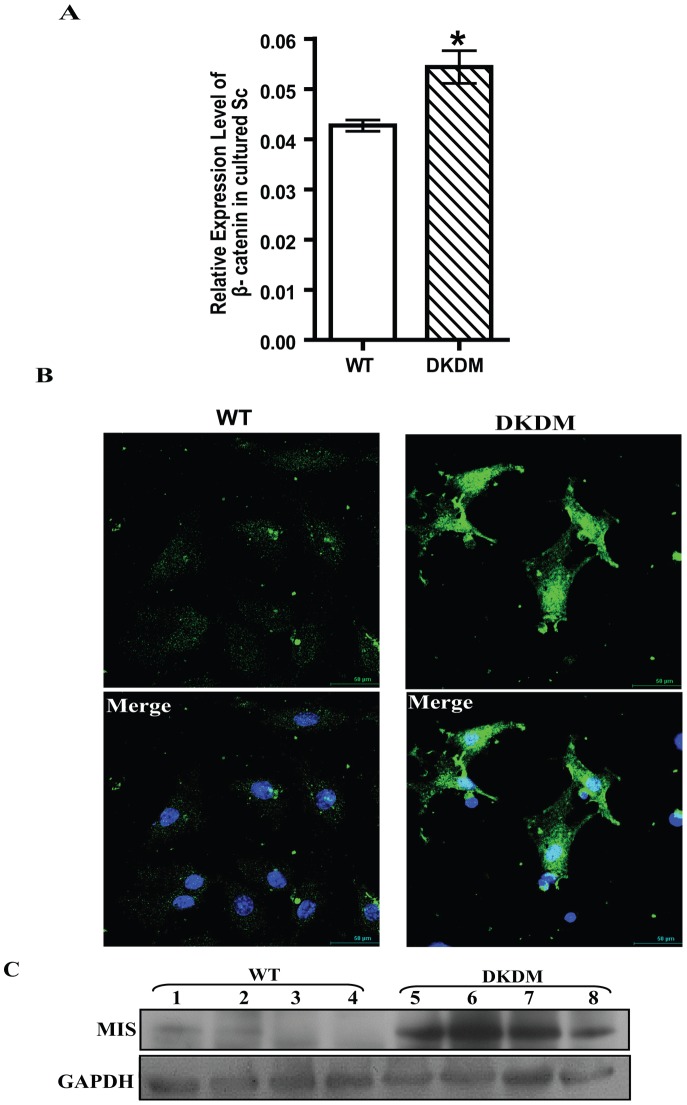
Figure 6. DKK3 mediated regulation of β-CATENIN activity in Sc.
(A) Relative quantity of β-CATENIN mRNA levels expressed in cultured Sc isolated from WT mice (open bar) and DKDM (hatched bar). Real time PCR data of Sc isolated from four or more individual mice of each group is represented as mean +/− SEM (*p<0.05). (B) Nuclear localization of β-CATENIN in the purified cultures of Sc isolated from WT mice and DKDM. Nuclear localization of β-CATENIN in Sc of DKDM can be seen. Merged image represents nuclear localization of β-CATENIN (green) along with nuclear staining with DAPI (blue). All these images are representatives of atleast three random visual fields obtained from the Sc isolated from four or more individual mice of each group. Scale bar: 50 µm. (C) Western blot analysis of MIS from the testes of WT mice and DKDM at ten weeks of age. Lanes 1–4 represents testicular lysates from four different WT mice, Lanes 5–8 represents testicular lysates from four different DKDM. The quantity of Glyceraldehyde-3-phosphate dehydrogenase (GAPDH) used as a housekeeping gene is shown in the lower panel. Note: equal amount of protein was loaded in each well.

