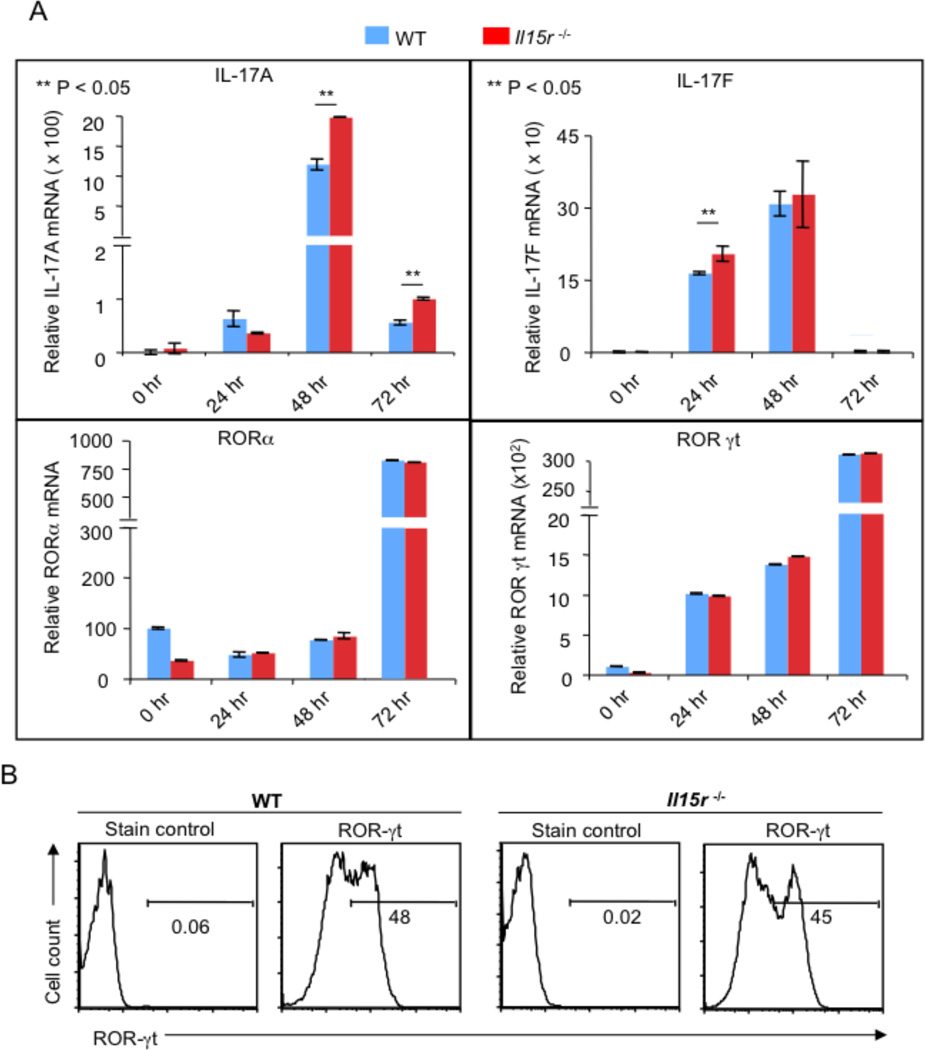
Figure 4. IL-15 limits IL-17A expression independently of ROR-γt expression.
(A) WT or Il15r−/− cells were stimulated as in Fig. 3C. RNA was isolated at indicated times of stimulation to assess the il-17a, il-17f, ror-α or ror-γt RNA levels (indicated by Y axes). These data are representation of 2 independent experiments with triplicate samples. (B) WT or Il15r−/− cells stimulated for 48 hours as in (A) were stained with isotype control antibody (Stain control) or anti Ror-γt antibody (Ror-γt). Shown is the fraction of cells in the indicated gate. Gates were drawn based on “Unstained” controls (not shown). These data represent 3 independent experiments.

