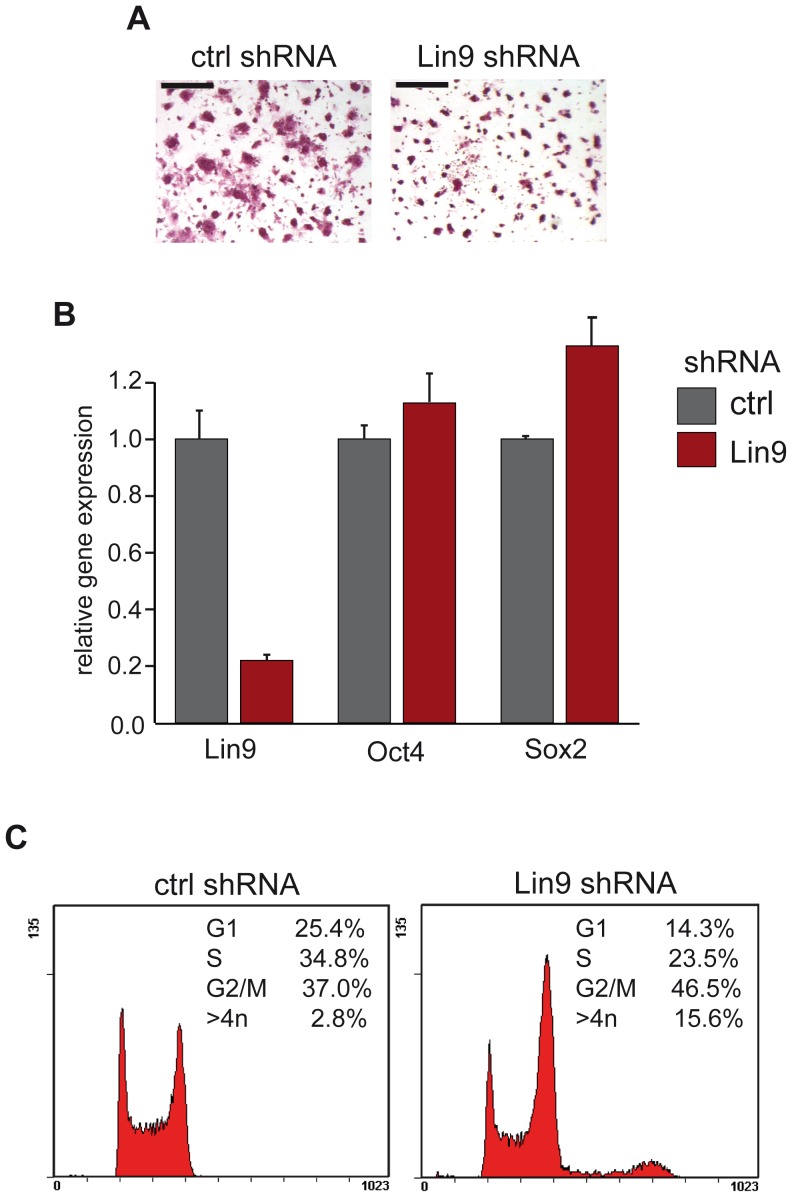
Figure 3. Cell cycle arrest in G2/M after depletion of LIN9.
(A) Alkaline-phosphatase (AP) staining of control cells and LIN9 depleted cells. Scale bar: 200 µM (B) Expression of pluripotency markers Oct4 and Sox2 was analyzed in control-depleted cells and LIN9 depleted cells by RT-qPCR. (C) The cell cycle profile of LIN9 depleted ESCs and of control cells was analyzed by flow cytometry.

