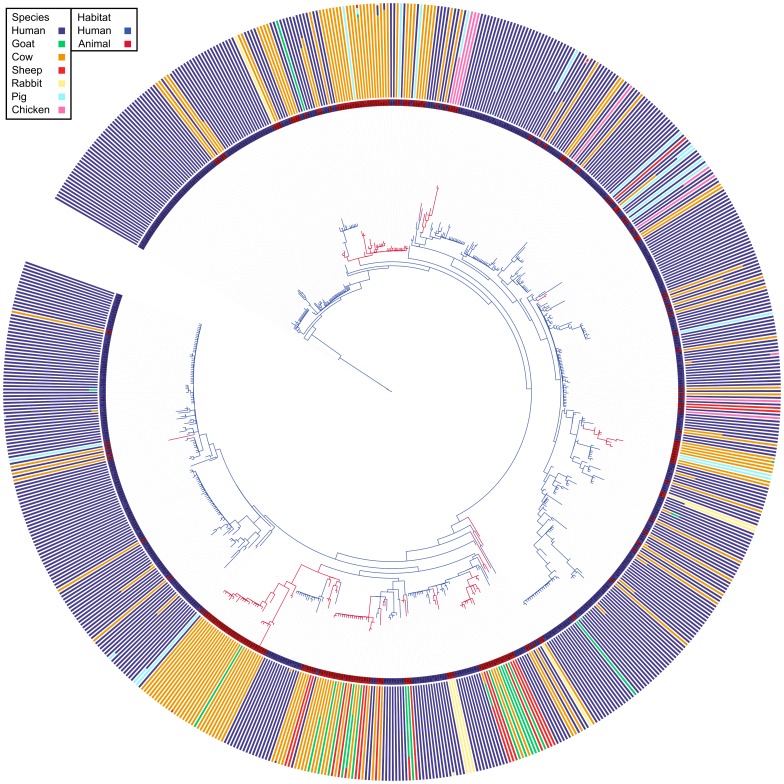
Figure 1. A maximum likelihood phylogeny of 696 MLST STs derived from human and animal hosts.
A maximum likelihood phylogeny of 696 MLST STs derived from human and animal hosts. Branch colours describe habitat associations inferred by AdaptML (Human – Blue, Animal – Red). External bars represent the normalised proportions of isolates from each of the seven species for each ST. Internal colours represent the most common source of isolation for each ST, this is used as the ecology marker in the AdaptML inputs. (Human – Blue, Animal – Red).

