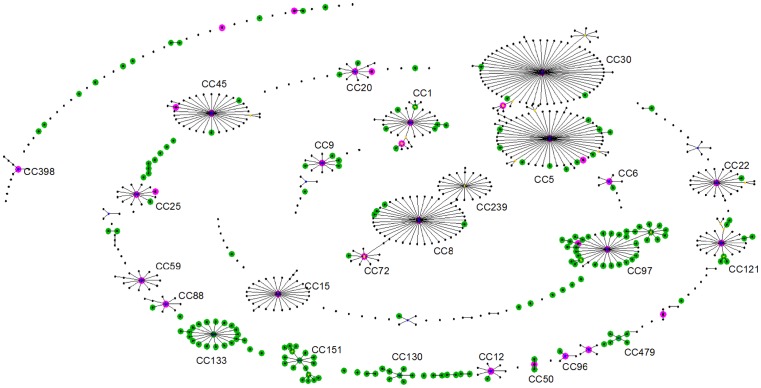
Figure 2. A Comparative eBURST plot of 696 STs from human and animal hosts.
Comparative eBURST of 696 STs. Genotypes from the human habitat are shown in black, genotypes from the animal habitat are shown in green. Genotypes found in both habitats are highlighted in pink. Nodes with yellow centers indicate genotypes defined by eBURST as sub-founders within a larger clonal complex.

