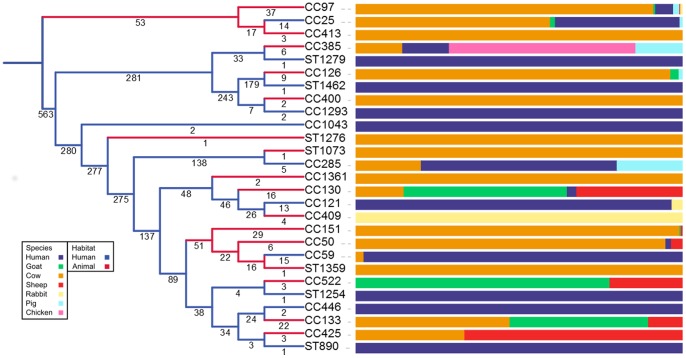
Figure 3. A pruned cladogram describing all 15 host switching events within the S. aureus population sample.
Values attached to branches represent the number of unique STs entering each node, from left to right. Leaf labels indicate the defining ST or CC. Bars represent the distributions of isolates for each terminal clade, colours for each species are the same as in figure 1. Clades which underwent no switches are pruned from the tree at nodes where the branch containing them is uniform with the ancestral state. Branch colours represent the inferred habitat type (blue – human, red – animal). Asterisks mark points where host switching events occur.

