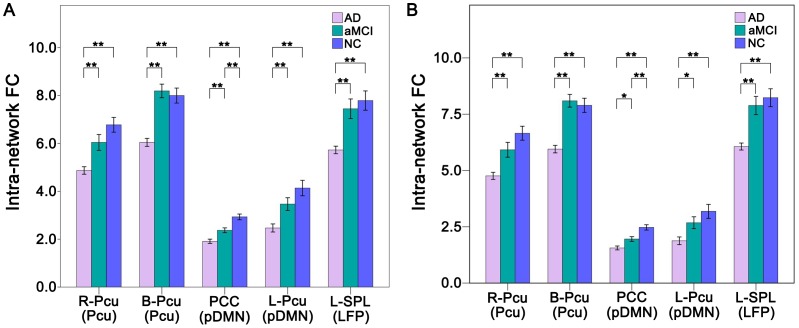
Figure 4. FC differences within the RSNs across groups without (A) and with (B) GMV correction.
The x-axis represents the brain regions of the RSNs (parenthesis), and the y-axis represents the strength of intra-network FC. Error bars indicate the standard errors of the means. *P<0.05, uncorrected; **P<0.05, Bonferroni correction. Abbreviations: AD, Alzheimer’s disease; aMCI, amnestic mild cognitive impairment; B, bilateral; FC, Functional connectivity; GMV, grey matter volume; L, left; LFP, left frontoparietal network; NC, normal controls; Pcu, precuneus; pDMN, posterior default mode network; PCC, posterior cingulate cortex; R, right; SPL, superior parietal lobule.

