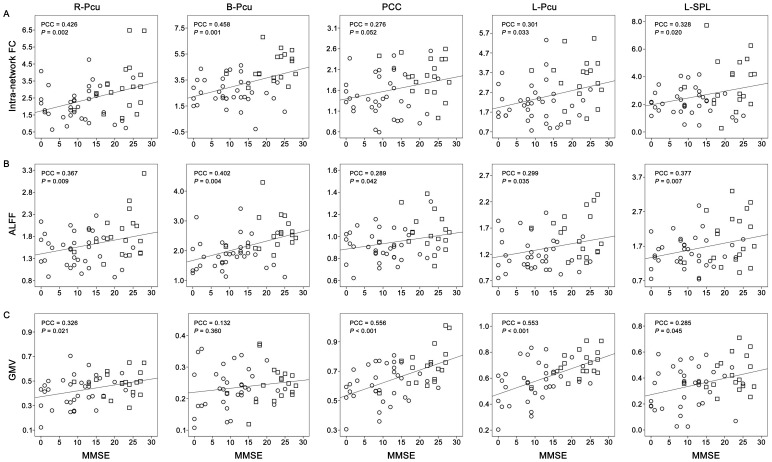
Figure 8. Scatter plots of intra-network FCs (A), ALFFs (B), and GMVs (C) versus MMSE scores.
The circles represent the Alzheimer’s disease subjects and the squares represent the amnestic mild cognitive impairment subjects. Abbreviations: ALFF, amplitude of low-frequency fluctuation; B, bilateral; FC, functional connectivity; GMV, grey matter volume; L, left; MMSE, Mini-Mental State Examination; PCC, partial correlation coefficient; PCCa, posterior cingulate cortex; Pcu, precuneus; R, right; SPL, superior parietal lobule.

