
Figure 1. The system used for MD simulations.
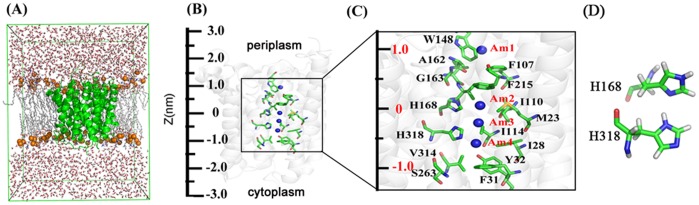
A, Side view of the simulation system. AmtB is shown with the green-colored ribbon representation. Phosphate atoms of the lipid are drawn as orange spheres and the other atoms are represented as white lines (hydrogen atoms are not shown for clarity). Water molecules are displayed as red and white sticks. The front half of the bilayer is not shown for clarity. B, The structure of the AmtB channel (1U7G) with z axis indicated on the left. C, The detailed structure from the Am1 site to Am4 site in the AmtB channel (from z = −1.5 nm to z = 1.5 nm). Certain key residues are indicated to facilitate the interpretation of the AmtB PMFs (Figs. 4A and 4B). D, The state of the neutral His-168–His-318 system used in the simulation.