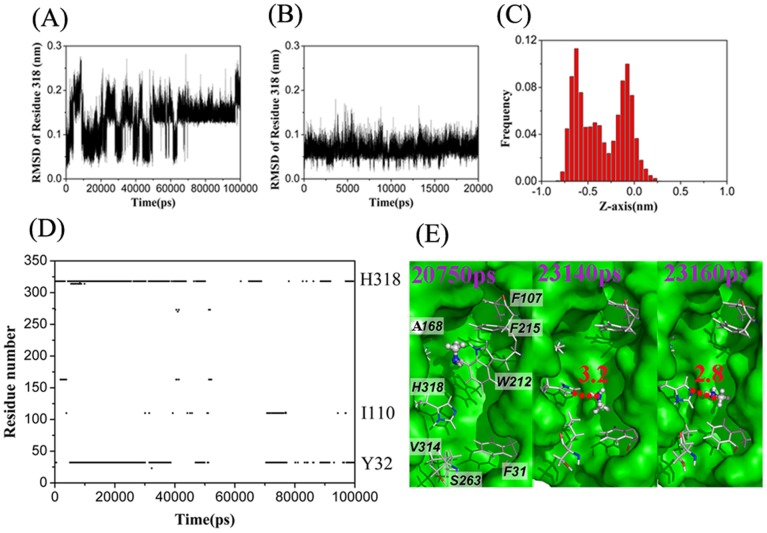
Figure 5. Effects of methylamine conduction through H168A AmtB.
The root-mean-square deviations (RMSD) of the atoms of His318 relative to their initial structure as a function of simulation time from the trajectories of methylamine (A) and ammonia (B) through H168A AmtB. C, Frequency distribution for the location of methylamine along the Z-axis of the channel in H168A AmtB (trajectory B1, data were collected in the whole trajectory). D, The residues of H168A AmtB involved in hydrogen bonds with methylamine versus simulation time in the trajectory B1. E, Side views of three snapshots (at 20750, 23140, and 23160 ps, respectively) showing the trap of methylamine at site z≈0 nm by forming hydrophobic contacts with residues around A168 and at z≈−0.6 nm by forming a hydrogen bond with H318 respectively. Hydrogen bonds are shown as red dashed lines.

