
Figure 8. Distance between the sidechains of residues Phe31 and Val314 versus time in the process of substrate leaving the conduction channel (Only the first 20 ns were plotted for comparison).
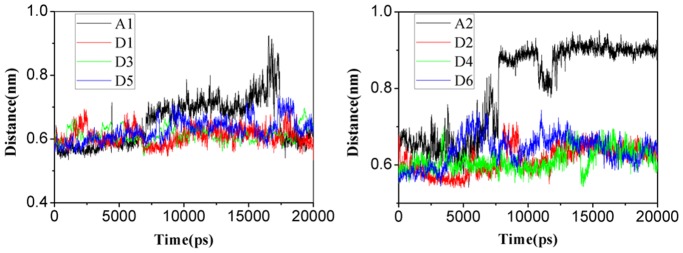
A. Simulations for MA. B. Simulations for NH3 in wild type AmtB (trajectories A1 and A2) and H168A/H318A variant (trajectories D1 to D6). A1 and A2 are colored in black, D1 and D2 are in red, D3 and D4 are in green, D5 and D6 are in blue, respectively.