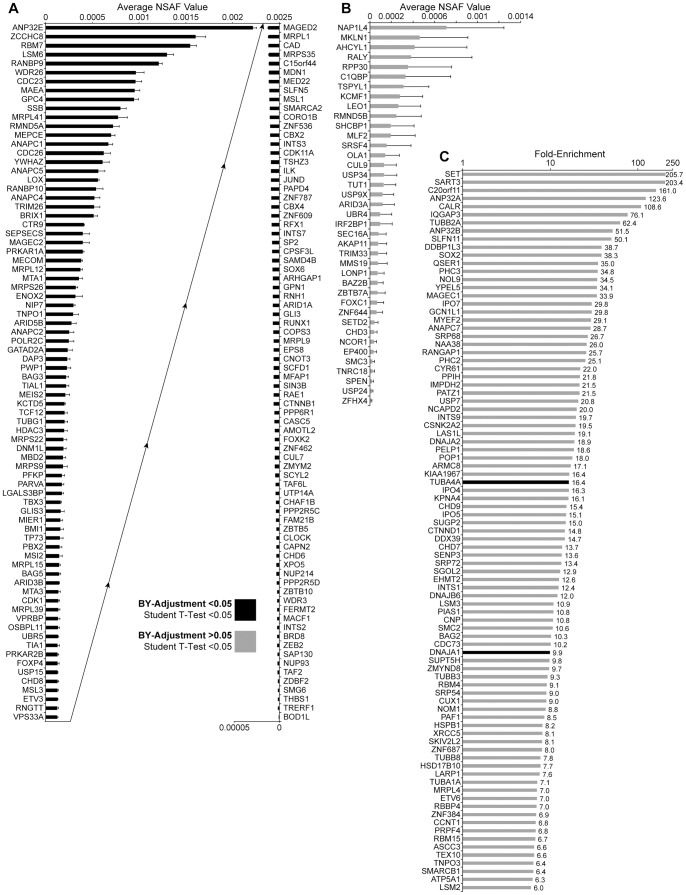
Figure 2. SOX2-associated proteins identified in DAOY MB tumor cells by MudPIT analysis.
(A) Proteins that were identified in all three induced M2-bead eluates, but not identified in uninduced samples, as SOX2-associated proteins by MudPIT analysis, which were statistically significant according to the BY-adjusted method (p<0.05). NSAF values of the three replicates are averaged and the error bars represent standard deviation. The plot is split in two; the ‘Average NSAF Values’ of the left half ascend left to right, and the ‘Average NSAF Values’ of the right half ascend right to left. (B) Proteins identified in 3 of 3, Dox-induced, but not in uninduced, DAOY MudPIT replicates that were statistically significant according to the student’s t-test (p<0.05), but were not significant according to the BY-adjustment (p>0.05). (C) Proteins that were identified in all three induced but at least one uninduced MudPIT sample, are plotted according to fold enrichment (NSAF values) in Dox-induced samples compared to uninduced. Only proteins with enrichment values >6-fold were included. Proteins depicted with a black bar had enrichment values that were statistically significant according to the BY-adjustment (p<0.05). Proteins depicted with gray bars were statistically significant according to the student’s t-test (p<0.05), but not significant according to the BY-adjustment (p>0.05).

