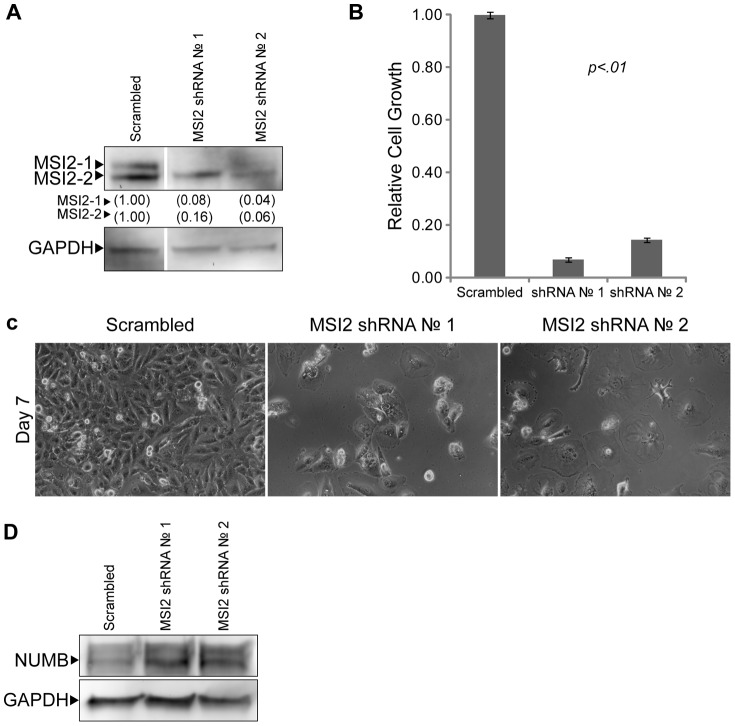
Figure 4. Knockdown of MSI2 in DAOY MB cells.
(A) Western blot analysis of MSI2 levels in DAOY whole cell extracts 96 hours after infection with Scrambled or MSI2 shRNA lentiviruses. Two isoforms were detected: isoform 1 (MSI2-1) and isoform 2 (MSI2-2). GAPDH was probed as a loading control. MSI2 levels are quantified, with levels found in the Scrambled control set to 1.00. (B) Cell growth was examined in triplicate by MTT assay 6 days after being plated at 104 cells per well of a 12-well plate. The data shown are averages relative to the Scramble control. Error bars represent standard deviation. P values were determined by student t-test and found to be <.01 for both MSI2 shRNA 1 and 2. (C) Photomicrographs of DAOY MB cells following infection with either non-specific (Scrambled) or MSI2 targeting (No. 1, No. 2) shRNA lentiviruses. Cells were infected on Day 0, selected using medium supplemented with puromycin on Day 1 and refed fresh medium on Day 2. Cells were photographed on day 7 after infection. (D) Western blot analysis of NUMB in DAOY MB extracts used in Figure 4A.

