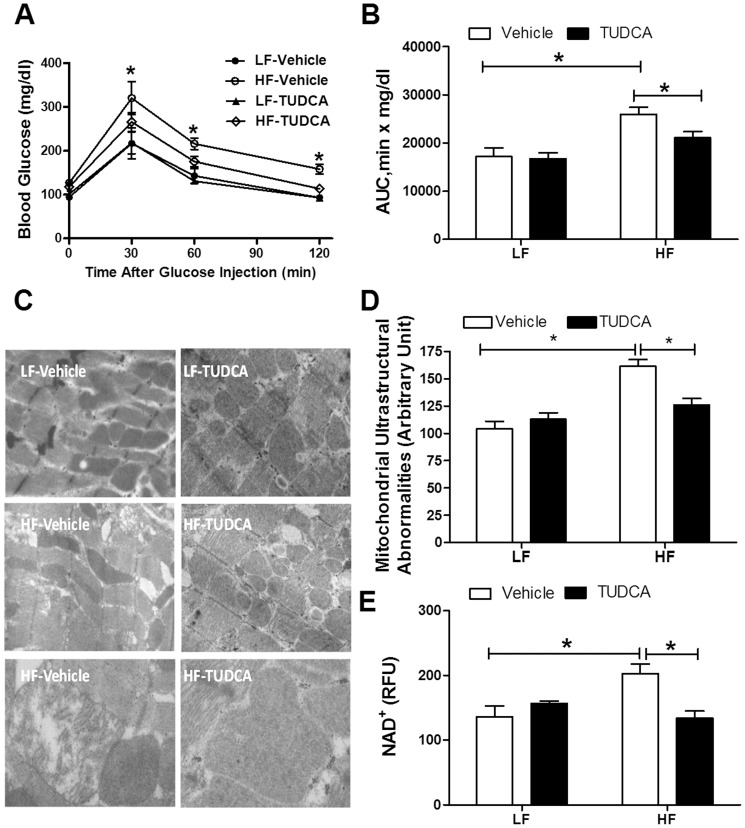
Figure 1. Intraperitoneal glucose tolerance test (IPGTT, 2 g/kg), myocardial ultrastructural and mitochondrial properties in low fat (LF) or high fat (HF)-fed C57 mice with or without TUDCA treatment (300 mg/kg for 15 days).
A: Serum glucose levels following intraperitoneal glucose challenge; B: Area under the curve (AUC) for IPGTT; C: Transmission electron microscopic micrographs of left ventricular tissue; Normal myofilament and mitochondrial ultrastructure may be seen in LF, LF-TUDCA and HF-TUDCA groups while myocardium in HF group displays irregular and deformed myofibril structure, some swollen mitochondria with cristae loss. Original magnification = ×15,000 for upper and middle panels; Original magnification = ×30,000 for bottom panels; D: Quantitative analyses of mitochondrial ultrastructural abnormalities and E: Mitochondrial permeation transition pore (mPTP) opening measured using NAD+ level; Mean±SEM, n = 4 mice per group, *p<0.05.

