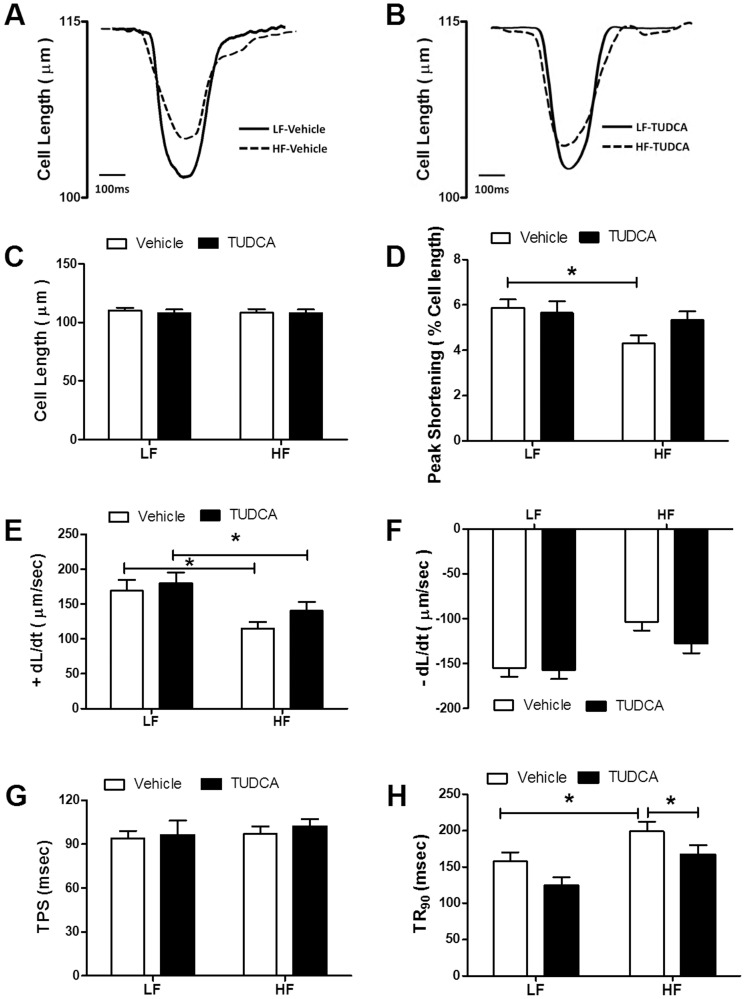
Figure 2. Cardiomyocyte contractile function at 25°C in low fat (LF) or high fat (HF)-fed C57 mice with or without TUDCA treatment (300 mg/kg for 15 days).
A: Representative traces depicting cell shortening in LF and HF-fed mice; B: Representative traces depicting cell shortening in LF and HF-fed mice with TUDCA treatment; C: Resting cell length; D: Peak shortening (PS, normalized to resting cell length); E: Maximal velocity of shortening (+dL/dt); F: Maximal velocity of relengthening (−dL/dt); G: Time-to-PS (TPS); and I: Time-to-90% relengthening (TR90). Mean±SEM, n = 60–64 cells from 3 mice per group, *p<0.05 (two-way ANOVA).

