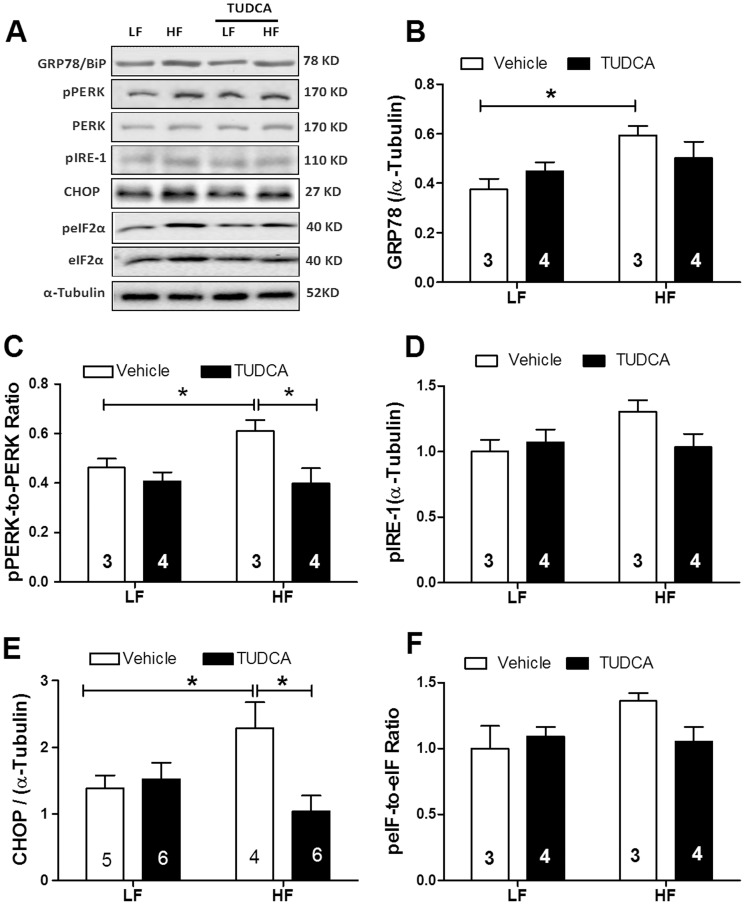
Figure 4. Expression of ER stress proteins in myocardium from low fat (LF) or high fat (HF)-fed C57 mice with or without TUDCA treatment (300 mg/kg for 15 days).
A: Representative gel blots depicting levels of GRP78/BiP, pPERK, PERK, CHOP, eIF2α, peIF2α and α-tubulin (as loading control) using specific antibodies; B: GRP78/Bip expression; C: pPERK-to-PERK ratio; D: pIRE-1 level; E: CHOP expression; and F: peIF2α-to-eIF2α ratio. Mean±SEM; sample sizes are denoted in the bar graphs, *p<0.05 (two-way ANOVA).

