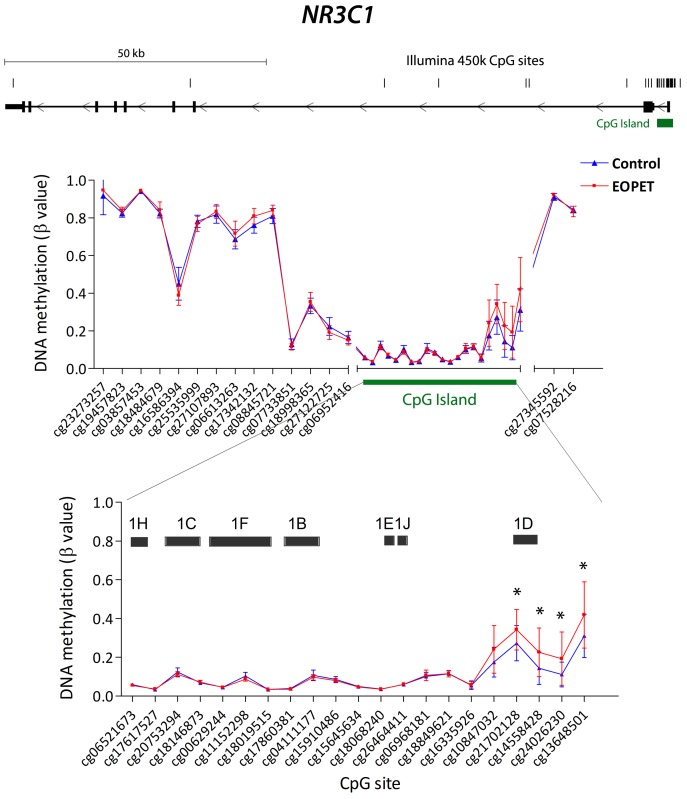
Figure 1. CpG sites on the Illumina Infinium HumanMethylation450 BeadChip array across the NR3C1 gene region.
Upper graph: DNA methylation at each CpG site in control (n = 19) and early onset pre-eclampsia (EOPET; n = 19) placentae. Lower graph: enlargement of region associated with CpG island containing multiple alternative first exons (black boxes). The Illumina CpG probe identifier is indicated by cg# and the position of CpG sites on the graphs are not to scale. *P<0.05.

