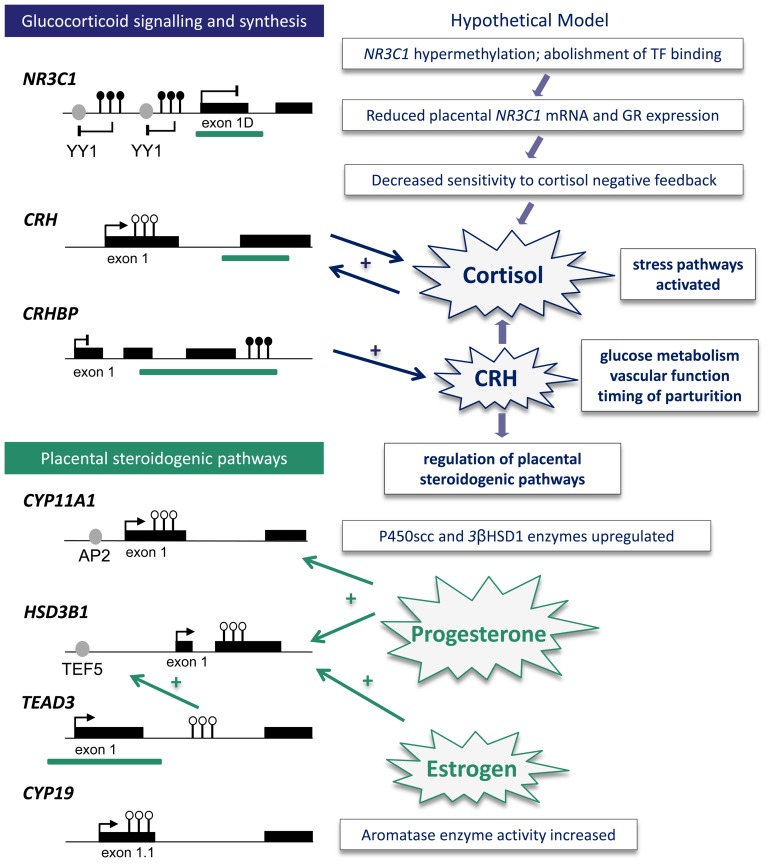
Figure 6. Model of altered stress and hormonal signalling gene-pathways in pre-eclampsia.
Left hand side: summary of altered DNA methylation at specific CpG sites across candidate genes, where black and white circles indicate gain or loss of methylation, respectively. Coding regions are indicated by black rectangles and transcription factor (TF) binding motifs are represented by grey circles and include yin yang 1 (YY1; putative), activated protein 2 (AP2; known) and transcription enhancer factor 5 (TEF5; known). Bent lines represent transcription start sites: arrow or blunt heads hypothesise increased or decreased expression, respectively. Green bars represent CpG islands. Annotations are of approximate location and distance. Right hand side: hypothesised model of the downstream effects of altered placental DNA methylation at candidate genes. NR3C1: nuclear receptor subfamily 3, group C, member 1, CRH: corticotropin releasing hormone, CRHBP: CRH binding protein, HSD3B1∶3β-hydroxy-delta-5-steroid dehydrogenase type 1, TEAD3: TEA domain family member 3, GR: glucocorticoid receptor, HSD11B2∶11β-hydroxysteroid dehydrogenase type 2, P450scc: P450 side chain cleavage, 3βHSD1∶3β-hydroxysteroid dehydrogenase type 1.

