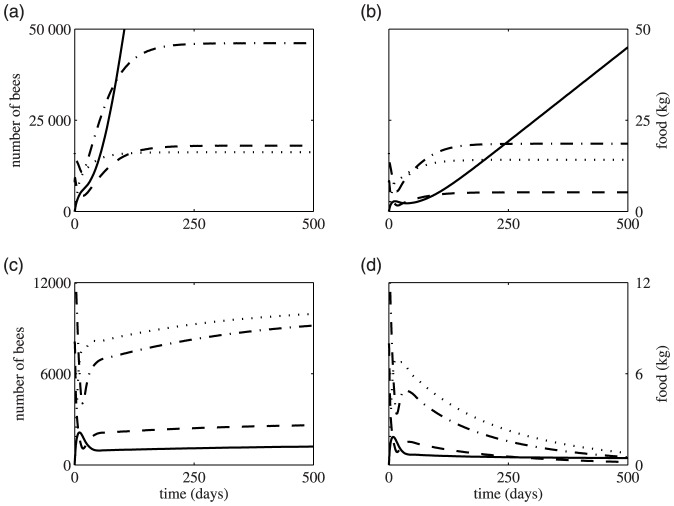
Figure 2. Population and food behaviour over time for different rates of forager mortality.
In all plots, the solid line represents food, the dashed line foragers, the dash-dot line hive bees and the dotted line brood. Parameter values are L = 2000,  = 1/9, v = 5000,
  = 0.75,
  = 0.25,
  = 0.25, b = 500, c = 0.1,
  = 0.007,
  = 0.018, and
  = 12. In (a) m = 0.1; (b) m = 0.3;(c) m = 0.42; (d) m = 0.5. In all plots the hive starts with 16000 hive bees, 8000 foragers and no brood or food at t = 0. Note that (c) and (d) have a different vertical scale to (a) and (b).

