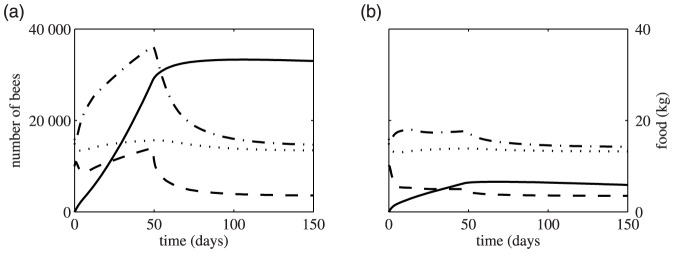
Figure 4. The effect of suddenly increased death rates.

Parameter values are as for Figure 2. The solid lines represents food, the dotted lines brood, the dash-dot lines hive bees and the dashed lines foragers. When t = 50, the death rate m is reset from its initial value to 0.42. In (a) the initial death rate is m = 0.1 and in (b) the initial death rate is m = 0.3.. In both plots the hive starts with 16000 hive bees, 10000 foragers, 15000 uncapped brood items and no food at t = 0.
