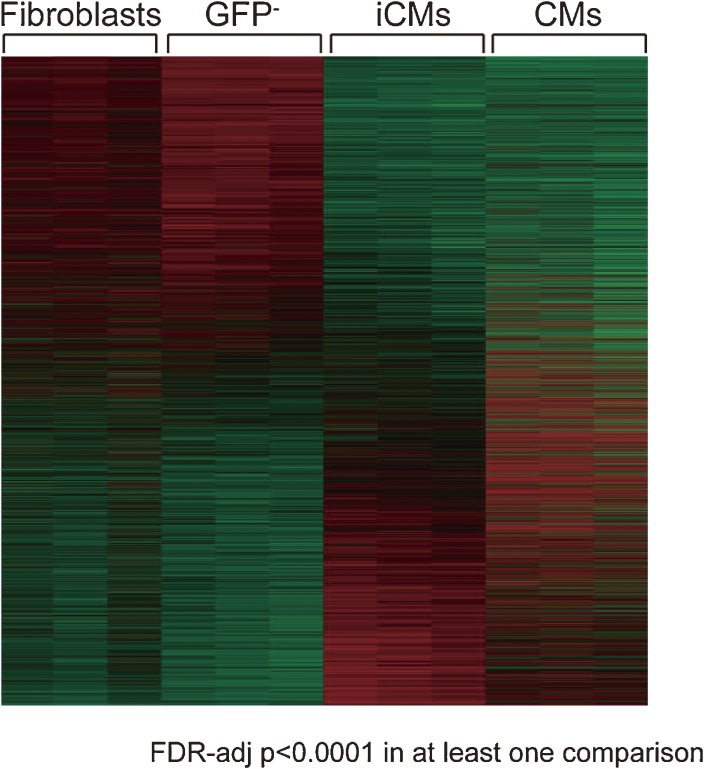
Figure 4.
Global gene expression pattern of induced cardiomyocytes is similar to cardiomyocytes. Heatmap image of microarray data illustrating differentially expressed genes among fibroblasts, α-MHC-GFP− cells (GFP−), iCMs (α-MHC-GFP+ cells sorted 4 weeks after GMT transduction) and cardiomyocytes (CMs) (n = 3 in each group). FDR-adj p < 0.0001 in at least one comparison was shown. Global gene expression pattern of iCMs is not identical but similar to cardiomyocytes.14)

