

Abstract
The NRAS and BRAF genes are frequently mutated in melanoma, suggesting that the NRAS-BRAF-MEK-ERK signaling pathway is an important target for therapy. Two classes of drugs, one targeting activated BRAF and one targeting MEK, are currently undergoing clinical evaluation. We have analysed the NRAS and BRAF mutational status of a series of 44 early passage lines developed from New Zealand patients with metastatic melanoma. 41% of the lines analysed had BRAF mutations, 23% had NRAS mutations, and 36% had neither. We then determined IC50 values (drug concentrations for 50% growth inhibition) for CI-1040, a commonly used inhibitor of MEK kinase; trametinib, a clinical agent targeting MEK kinase; and vemurafenib, an inhibitor of mutant BRAF kinase. Cell lines with activating BRAF mutations were significantly more sensitive to vemurafenib than lines with NRAS mutations or lines lacking either mutation (p < 0.001). IC50 values for CI-1040 and trametinib were strongly correlated (r = 0.98) with trametinib showing ~100-fold greater potency. Cell lines sensitive to vemurafenib were also sensitive to CI-1040 and trametinib, but there was no relationship between IC50 values and NRAS mutation status. A small number of lines lacking a BRAF mutation were sensitive to CI-1040 but resistant to vemurafenib. We used western blotting to investigate the effect on ERK phosphorylation of CI-1040 in four lines, of vemurafenib in two lines and of trametinib in two lines. The results support the view that MEK inhibitors might be combined with BRAF inhibitors in the treatment of melanomas with activated BRAF. The high sensitivity to trametinib of some lines with wildtype BRAF status also suggests that MEK inhibitors could have a therapeutic effect against some melanomas as single agents.
Keywords: mitogen-activated protein kinase pathway, melanoma treatment, NRAS, BRAF, MEK, ERK, vemurafenib, trametinib
Introduction
Malignant melanoma is an important public health issue, particularly in Australia and New Zealand where the incidence rates for melanoma are very high (Coory et al., 2006; Liang et al., 2010). While early stage melanoma can usually be treated successfully by surgery, metastatic melanoma has a poor survival rate and is highly resistant to conventional cytotoxic chemotherapy. Activating mutations in the BRAF gene have been reported in 40–70% of melanomas and activating mutations in the NRAS gene in another 10–30% (Davies et al., 2002). There is considerable interest in developing therapies targeting this pathway, and clinical trials of drugs such as vemurafenib (PLX4032), which target mutant BRAF protein, have provided very promising results with 81% of patients with BRAF mutant melanoma having clinical responses in a Phase I trial (Flaherty et al., 2010). Since preclinical studies indicate that BRAF inhibitors are ineffective in melanomas lacking BRAF mutations and may even enhance growth (Hatzivassiliou et al., 2012), advanced clinical trials of vemurafenib and other BRAF inhibitors are being carried out specifically in patients whose melanomas contain BRAF mutations (Solit et al., 2006; Flaherty et al., 2010).
Resistance to BRAF inhibitors develops relatively rapidly because of BRAF-independent activation of MEK and ERK (Johannessen et al., 2010) and other chemotherapeutic approaches will be necessary, both for melanomas lacking mutant BRAF and for melanomas that have developed resistance. The MEK protein, which functions downstream from BRAF, is thus a further potential target (Johannessen et al., 2010). Preclinical studies with MEK inhibitors reported that BRAF mutant melanoma cells growing both in vitro and in vivo as xenografts were more responsive to MEK inhibition than cell lines with wild type BRAF status (Davies et al., 2002; Solit et al., 2006). Furthermore, the new MEK inhibitor trametinib (GSK1120212) has shown evidence of clinical efficacy against melanoma (Falchook et al., 2012), and has shown survival benefits in phase III trial (Flaherty et al., 2012).
In this study, we have characterized the BRAF and NRAS mutation status of a series of melanoma cell lines developed from New Zealand patients with metastatic melanoma (Marshall et al., 1994; Charters et al., 2011; Kim et al., 2012). We determined the IC50 values of these cell lines to CI-1040, a MEK inhibitor that has been utilized extensively in preclinical studies (Sebolt-Leopold, 2004) and compared these values to those for the mutant BRAF inhibitor vemurafenib. For a subset of cell lines we determined IC50 values for trametinib. Since rapid development of resistance (within hours) through up-regulation of MEK pathway signaling in the absence of BRAF mutations has been reported in melanoma cell lines (Friday et al., 2008), we have also measured in some cell lines the time-dependent effects of CI-1040 and vemurafenib on ERK phosphorylation.
Materials and methods
Cell lines and tissue culture
New Zealand Melanoma (NZM) cell lines were derived from metastatic tumors and developed at the Auckland Cancer Society Research Centre, New Zealand. The cell lines were maintained in α-MEM medium (Invitrogen), supplemented with 5% foetal calf serum (Invitrogen), penicillin-streptomycin sulfate, and insulin-transferrin-selenite, in a 37°C incubator at 5% CO2 and O2. The final concentrations of the supplements in media were 100 units/mL penicillin G, 100 μg/mL streptomycin sulfate, 5 μg/mL insulin, 5 μg/mL transferrin, and 5 ng/mL sodium selenite.
Genomic profiling of cell lines
DNA from cell lines was sequenced for activating mutations in NRAS exon 2 and 3 and BRAF exon 11 and 15. DNA was extracted using phenol-chloroform-isoamyl alcohol. Exons of interest were amplified by PCR using Taq polymerase from Qiagen. The primer sequences for BRAF exon 15 and NRAS exon 2 and 3 were designed using DNA Star; the sequences are provided in Table 1. The primers for BRAF exon 11 are from a published source (Davies et al., 2002). The PCR conditions were as follows: an initial denaturation step at 95°C for 5 min, followed by 30 cycles (BRAF exon 11) or 40 cycles (BRAF exon 15, NRAS exon 2 and 3) consisting of denaturation at 95°C for 1 min, annealing at the appropriate temperature for 1 min, extension at 72°C for 1 min, followed by a final extension step at 72°C for 10 min. The annealing temperatures for the PCR reactions were as follows: 60°C for BRAF exon 11, 56°C for BRAF exon 15, 58°C for NRAS exon 2, and 60°C for NRAS exon 3. Polyethylene glycol precipitation (Lis and Schleif, 1975) was used to purify the NRAS exon 2 and 3 and BRAF exon 15 PCR products. Enzymatic digestion of unused PCR reaction ingredients by exonuclease 1 Affymetrix USB and shrimp alkaline phosphatase Affymetrix USB was used to purify BRAF exon 11.
Table 1.
BRAF and NRAS sequencing primers.
| Gene and exon | Primers | Primer sequence | Amplicon size | Location on reference sequence |
|---|---|---|---|---|
| BRAF exon 11 | Forward | Davies et al. (2002) | 271 bp | 140481587-140481567 |
| Reverse | Davies et al. (2002) | 140481275-140481298 | ||
| BRAF exon 15 | Forward | CACCTCATCCTAACACATTTCAAG | 765 bp | 140453433-140453410 |
| Reverse | TTTCAACAGGGTACACAGAACAT | 140452668-140452690 | ||
| NRAS exon 2 | Forward | ATTAATCCGGTGTTTTTGCGTTCT | 633 bp | 115258944-115258921 |
| Reverse | CATCTCTGAATCCTTTATCTCCAT | 115258311-115258334 | ||
| NRAS exon 3 | Forward | AACAGCACAAATAAAACAGTCCAG | 799 bp | 115256971-115256948 |
| Reverse | GGTTCCAAGTCATTCCCAGTA | 115256172-115256192 |
The reference sequences cited are NC_000007.13 (BRAF) and NC_000001.10 (NRAS).
The PCR products were sequenced using thermal cycle sequencing, with Big Dye Terminator 3.1 chemistry (Applied Biosystems). The sequencing cycle conditions were as follows: an initial denaturation step at 95°C for 5 min followed by 25 amplification cycles of 1 min each of denaturation at 95°C, annealing at 50°C for 5 min, and primer extension at 60°C for 4 min. The sequencing products were purified by ethanol precipitation and the sequences run on an Applied Biosystems 3130XL capillary sequencing machine at the Centre for Genomics and Proteomics, University of Auckland. Mutations were confirmed by sequencing in the opposite direction using separately amplified DNA.
Determination of IC50 values
The sensitivity of the cell lines to inhibitors was measured using a 3H-thymidine incorporation method (Marshall et al., 1992). Melanoma cells were plated in 96 well plates at 1000 cells per well and incubated overnight at 37°C at 5% CO2 and O2. Drugs were added and plates incubated for 5 days at 37°C at 5% CO2 and O2. 3H-thymidine (0.04 μCi/well), 5-fluorodeoxyuridine (0.1 μM), and thymidine (0.1 μM) were added 6 h before harvesting the cultures. To harvest, Pronase (2 mg/mL in 4 mM EDTA in PBS) was added per well for 1 h and the plates incubated at 37°C at 5% CO2 and O2, to detach the cells. The cells were transferred onto Wallac glass fiber filter mats using a Tomtec cell harvester, and the beta emission counted using a Wallac Trilux Microbeta scintillation counter. IC50 values (mean and SEM) were calculated using SigmaPlot.
Western blot analysis
Cells were plated in 6 well tissue culture plates (Falcon) at 2.5 × 10⁵ cells per well and incubated overnight at 37°C at 5% O2 to allow the cells to attach. Drugs were added to the wells on the following day and the cells were harvested at the indicated time points using a lysis buffer containing phosphatase and protease inhibitors (Cheng et al., 2004). The protein concentration of cell lysates was determined using the bicinchoninic acid (BCA) assay and the lysates (50 μ g of protein per well) were subjected to western blotting. The proteins were transferred to PVDF membranes and probed with antibodies for p-ERK, total ERK, p-MEK, total MEK, p-AKT, total AKT, cyclin D1 (all from Cell Signaling Technology), tubulin (Sigma) and β-actin (Millipore). The western blots were photographed using a LAS3000 Luminescent Image Analyzer (Fuji), and quantified using Image J software.
Results
BRAF and NRAS mutations in melanoma cell lines
Screening results for the 44 melanoma cell lines are shown in Table 2. Thirteen lines (30%) had activating V600E and another 2 lines (5%) had activating V600K mutations. The NZM28 line contained a L584F amino acid substitution as well as a G469A substitution, the NZM41 line contained a D594N mutation, and the NZM37 had a Thr600ins mutation. The cell lines were also evaluated for mutations of the NRAS gene; four lines (9%) had a Q61K mutation, one a G12D mutation, one a G13L mutation, two a Q61H mutation, and one a Q61R mutation. All the identified mutations are described in the Welcome Trust COSMIC DNA mutation database.
Table 2.
Genetic and IC50 data for NZM cell lines.
| Cell line | BRAF status | BRAF DNA | NRAS status | NRAS DNA | CI-1040 IC50 (nM) | Trametinib IC50 (nM) | Vemurafenib IC50 (nM) |
|---|---|---|---|---|---|---|---|
| NZM1 | wildtype | WT | wildtype | WT | <7.8 | 1600 | |
| NZM2 | wildtype | WT | wildtype | WT | 8.7 | 0.48 | 150 |
| NZM3 | V600E | GTG to GAG 600 | wildtype | WT | 36 | 29 | |
| NZM4 | V600E | GTG to GAG 600 | wildtype | WT | 33 | 0.36 | 17 |
| NZM5 | wildtype | WT | wildtype | WT | 16 | 0.84 | 255 |
| NZM6 | V600E | GTG to GAG 600 | wildtype | WT | 65 | 59 | |
| NZM7 | V600E | GTG to GAG 600 | wildtype | WT | 38 | 0.85 | 33 |
| NZM9 | wildtype | WT | wildtype | WT | 72 | 1600 | |
| NZM10 | wildtype | WT | Q61K | CAA to AAA 61 | 23 | 0.63 | 2500 |
| NZM11 | V600E | GTG to GAG 600 | wildtype | WT | 120 | 15 | |
| NZM13 | wildtype | WT | wildtype | WT | 1070 | ||
| NZM14 | V600K | GTG to AAG 600 | wildtype | WT | 10 | 0.33 | 85 |
| NZM15 | wildtype | WT | Q61K | CAA to AAA 61 | <7.8 | 1050 | |
| NZM17 | wildtype | WT | Q61K | CAA to AAA 61 | 430 | 2000 | |
| NZM19 | wildtype | WT | wildtype | WT | 102 | 1600 | |
| NZM20 | V600E | GTG to GAG 600 | wildtype | WT | 9.1 | 0.30 | 13 |
| NZM21 | wildtype | WT | wildtype | WT | 101 | 0.75 | |
| NZM22 | wildtype | WT | wildtype | WT | 1410 | 10 | 1030 |
| NZM23 | wildtype | WT | wildtype | WT | 740 | 1040 | |
| NZM24 | wildtype | WT | G12D | GGT to GAT 12 | 21 | 760 | |
| NZM28 | G469A L584F | GGA to GCA 469 CTT to TTT 584 | wildtype | WT | 8.6 | 3.3 | |
| NZM29 | wildtype | WT | wildtype | WT | 710 | 900 | |
| NZM30 | V600E | GTG to GAG 600 | wildtype | WT | 22 | 0.35 | 66 |
| NZM31 | V600E | GTG to GAG 600 | wildtype | WT | 17 | 47 | |
| NZM33 | wildtype | WT | Q61R | CAA to CGA 61 | <7.8 | 0.36 | 2300 |
| NZM34 | V600E | GTG to GAG 600 | wildtype | WT | 64 | 72 | |
| NZM35 | wildtype | WT | wildtype | WT | 520 | 2.3 | 1040 |
| NZM36 | wildtype | WT | wildtype | WT | 8.5 | 2000 | |
| NZM37 | Ins T600 | Ins ACA 600 | wildtype | WT | 19 | 400 | |
| NZM38 | V600E | GTG to GAG 600 | wildtype | WT | 99 | 55 | |
| NZM39 | wildtype | WT | wildtype | WT | <7.8 | 0.35 | 1300 |
| NZM40 | wildtype | WT | Q61H | CAA to CAT 61 | 790 | 5.5 | 590 |
| NZM41 | D594N | TGA to TAA 594 | wildtype | WT | 200 | 660 | |
| NZM43 | V600K | GTG to AAG 600 | wildtype | WT | <7.8 | 170 | |
| NZM44 | wildtype | WT | wildtype | WT | 140 | 2000 | |
| NZM45 | wildtype | WT | Q61L | CAA to CTA 61 | 170 | 510 | |
| NZM46 | wildtype | WT | Q61H | CAA to CAT 61 | 10 | 140 | |
| NZM48 | wildtype | WT | Q61K | CAA to AAA 61 | 34 | 550 | |
| NZM49 | V600E | GTG to GAG 600 | wildtype | WT | 70 | 0.40 | 70 |
| NZM55 | V600E | GTG to GAG 600 | wildtype | WT | 28 | 3.8 | |
| NZM56 | wildtype | WT | wildtype | WT | 90 | 1.0 | 590 |
| NZM58 | V600E | GTG to GAG 600 | wildtype | WT | 67 | 0.33 | 25 |
| NZM61 | wildtype | WT | wildtype | WT | 90 | 0.75 | 560 |
| NZM63 | wildtype | WT | G13L | GGT to CGT 13 | <7.8 | 0.31 | 920 |
Sensitivity of melanoma lines to CI-1040, vemurafenib and trametinib
The response of the melanoma cell lines to the MEK and BRAF inhibitors was tested using IC50 assays and the results are shown in Table 2 and Figure 1. The main study, with CI-1040 (Figure 1A), showed a clustering of low IC50 values for CI-1040 and vemurafenib for cell lines with activating BRAF mutations (V600E and V600K). The NZM28 cell line, which contained both G469A and L584F substitutions was very sensitive to both inhibitors and thus fell into this cluster. On the other hand NZM37, with a Thr600 insertion, and NZM41, with a D594N substitution, were relatively insensitive to vemurafenib (Table 2). Lines with NRAS mutations (Q61K, G12D, Q61H, and Q61R) were all resistant to vemurafenib and there was no correlation between the presence of mutation and sensitivity to CI-1040. A smaller study (Figure 1B) compared cell line sensitivity to trametinib. IC50 values for trametinib were highly correlated with those for CI-1040 (r = 0.985) but trametinib was, on average, more than 100-fold more potent. Clustering of IC50 values was again observed, with all vemurafenib sensitive lines also showing sensitivity to trametinib.
Figure 1.
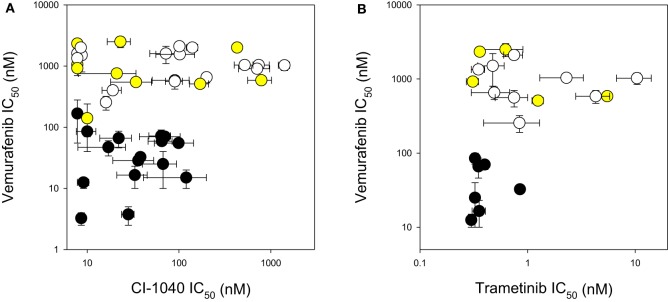
Comparison of IC50 values for (A) CI-1040 vs. vemurafenib and (B) trametinib vs. vemurafenib using a panel of melanoma cell lines. Black circles: mutant BRAF. Yellow circles: mutant NRAS. White circles: wildtype for BRAF and NRAS. Vertical and horizontal bars indicate the standard errors of the means where available; IC50 values of <7.8 nM are shown as 7.8 nM.
Modulation of ERK phosphorylation in response to MEK and BRAF inhibitors
In order to compare signaling changes in the ERK pathway to inhibition of proliferation, we measured changes to ERK phosphorylation induced by CI-1040, trametinib, and vemurafenib in NZM22, which is NRAS and BRAF wildtype and relatively resistant to all three inhibitors (Table 2), and in NZM4, which is BRAF mutant and relatively sensitive to the three inhibitors tested. ERK phosphorylation was more sensitive in NZM4 cells than in NZM22 cells in response to both CI-1040 and vemurafenib at both the 1-h and 24-h time points (Figure 2). Comparison of sensitivity to trametinib was also carried out but both cell lines were sensitive to the lowest drug concentration used.
Figure 2.
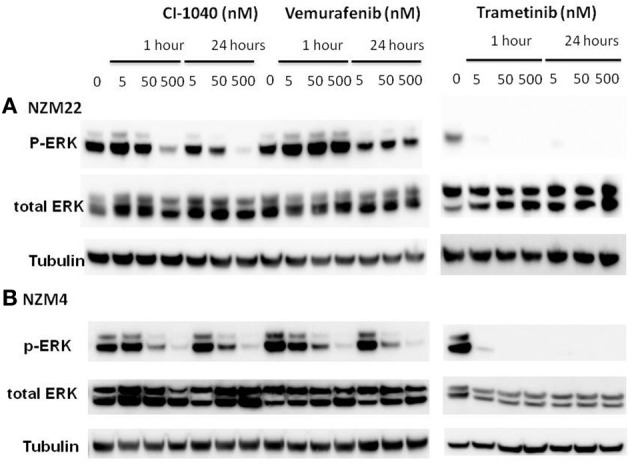
Western blots showing changes in ERK phosphorylation 1 and 24 h after addition of different concentrations of the MEK inhibitors CI-1040 and trametinib, and the mutant BRAF inhibitor vemurafenib. (A) NZM22 line (BRAF wild type). (B) NZM4 line (V600E BRAF).
ERK phosphorylation in response to CI-1040 was measured for NZM41, which is moderately resistant (IC50 = 200 nM). The phosphorylation status of MEK, which phosphorylates and activates ERK, was measured for comparison. Since expression of cyclin D1 has been reported to be down-regulated following MEK inhibition in cells with BRAF V600E mutations (Pritchard et al., 2007), expression of cyclin D1 was also measured, but there was no change in expression. ERK phosphorylation was inhibited at a CI-1040 concentration of 10 nM after 1 h but was comparatively unaffected after 24 h, even at 500 nM (Figure 3). This is in agreement with a report that sensitivity to a MEK inhibitor may decrease with exposure time (Friday et al., 2008). Interestingly, NZM41 showed evidence of CI-1040 resistance since MEK phosphorylation was increased following exposure to CI-1040 at 500 nM after 1 h and even at 50 nM after 24 h (Figure 3). The experiment was repeated with the NZM2 line, which is sensitive to CI-1040 (IC50 = 8.7 nM) and wildtype for BRAF and NRAS. ERK phosphorylation was highly sensitive to CI-1040 at both the 1-h and 24-h time points (Figure 4). No changes in MEK phosphorylation was observed but a decrease in cyclin D1 expression was apparent after 24 h.
Figure 3.
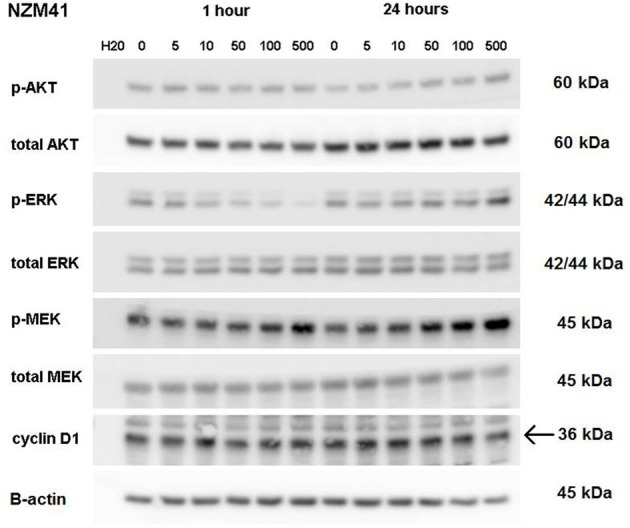
Western blots showing pathway signaling in response to CI-1040 (nanomolar concentrations) for the NZM41 line (BRAF D549N mutation) at 1 and 24 h. The arrow indicates the protein of interest in blots where non-specific bands are also present.
Figure 4.
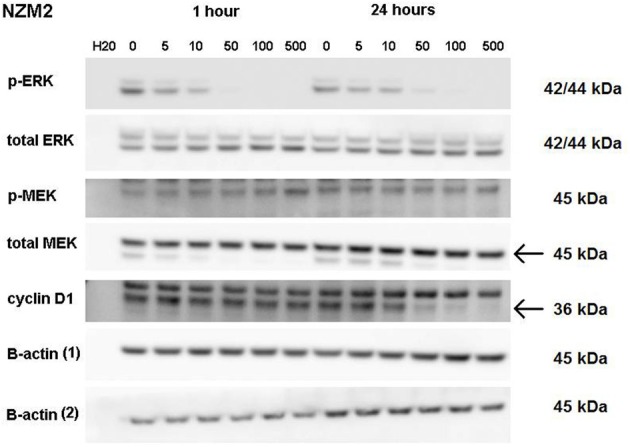
Western blots showing pathway signaling in response to CI-1040 (nanomolar concentrations) for the NZM2 line (BRAF wildtype) at 1 and 24 h. The arrows indicate the protein of interest in blots where non-specific bands are also present.
Discussion
New Zealand has a high incidence of melanoma and it was therefore of interest to compare the frequencies of activating BRAF and NRAS mutations in New Zealand-derived melanoma lines with published values. The BRAF V600E mutation frequently observed was found in this study at 30% (Table 2), lower than that reported by other groups (Davies et al., 2002; Houben et al., 2004; Edlundh-Rose et al., 2006; Thomas et al., 2007) while that for V600K was 5%. The mutation frequency for NRAS was 23% (Table 2), within the range reported by other groups (Davies et al., 2002; Houben et al., 2004; Edlundh-Rose et al., 2006; Thomas et al., 2007). The data in Figure 1 and Table 2 clearly show that cell lines with activating V600E and V600K mutations were generally sensitive to CI-1040, trametinib and vemurafenib inhibition. As shown in Table 2 the NZM28 cell line, which contained both G469A and L584F substitutions, was very sensitive to both inhibitors. SIFT algorithm analysis (Kumar et al., 2009) was undertaken to provide an indication of the effect of mutation, and predicted that the L584F mutation alters protein function, consistent with this effect. On the other hand NZM37, with a Thr600 insertion and NZM41, with a D594N substitution, were relatively insensitive to vemurafenib (Table 2), raising the question of why they might be selected for during melanoma development. The G469A mutation has been reported to have no enhancing effect on BRAF (Smalley and Flaherty, 2009) but it has been reported that kinase-dead BRAF mutations of D594 can have an indirect effect on tumor progression by enhancing CRAF activity (Heidorn et al., 2010). Several other studies have explored the relationship between mutation status and sensitivity to MEK inhibition for a variety of tumor types including melanoma, breast, ovarian, and lung cancers (Davies et al., 2002; Solit et al., 2006). In these studies, cell lines with BRAF mutations were very sensitive to MEK inhibition of cell growth while cell lines with NRAS mutations showed a range of sensitivities, in agreement with the present results.
It has been reported that either PI3K oncogenic mutations or deletion of PTEN reduces sensitivity of cells to MEK inhibitors (Wee et al., 2009). In this study, the NZM40 and NZM46 lines were found to have an activated mutated PI3K enzyme and the NZM6, NZM30, NZM34, and NZM43 lines were found to lack PTEN expression (Kim et al., 2012). However, there was no clear indication of altered sensitivity to CI-1040 among these cell lines. There are also reports that up-regulation of MEK can lead to reduced sensitivity of cells to MEK inhibitors (Friday et al., 2008). We investigated ERK phosphorylation in a number of melanoma lines (Figures 2–4). Although some evidence of loss of initial sensitivity in resistant lines was found (Figure 3) the pattern of phosphorylation results broadly followed that of the IC50 results.
In conclusion, we have assessed the responses of a series of 44 melanoma lines, generally of low passage number, to CI-1040, a prototypic MEK inhibitor, as well as to trametinib, a clinical MEK inhibitor and vemurafenib, a clinical BRAF inhibitor. We identified a sub-set of 16 lines (36%) with activating BRAF mutations (Figure 1) that showed sensitivity to both clinical inhibitors, supporting the hypothesis that a combination of both BRAF and MEK inhibitors might have advantages over either drug alone because of potentially synergistic inhibitory effects on signal transduction. We also identified a second sub-set of 10 cell lines (23%) that were resistant to vemurafenib but sensitive to a MEK inhibitor. Some but not all of these cell lines exhibited NRAS mutations, suggesting that some melanomas that are wildtype for both BRAF and NRAS may respond to trametinib, a MEK inhibitor. If this applies in vivo, then a proportion of melanoma patients whose disease is resistant to BRAF inhibitor therapy may respond to therapy with a MEK inhibitor.
Conflict of interest statement
The authors declare that the research was conducted in the absence of any commercial or financial relationships that could be construed as a potential conflict of interest.
Acknowledgments
This study was supported by doctoral scholarship funding from the Auckland Medical Research Foundation and from the Genesis Oncology Trust, and by the Auckland Cancer Society.
References
- Charters G. A., Stones C. J., Shelling A. N., Baguley B. C., Finlay G. J. (2011). Centrosomal dysregulation in human metastatic melanoma cell lines. Cancer Genet. 204, 477–485 10.1016/j.cancergen.2011.07.001 [DOI] [PubMed] [Google Scholar]
- Cheng S. W., Fryer L. G., Carling D., Shepherd P. R. (2004). Thr2446 is a novel mammalian target of rapamycin (mTOR) phosphorylation site regulated by nutrient status. J. Biol. Chem. 279, 15719–15722 10.1074/jbc.C300534200 [DOI] [PubMed] [Google Scholar]
- Coory M., Baade P., Aitken J., Smithers M., McLeod G. R., Ring I. (2006). Trends for in situ and invasive melanoma in Queensland, Australia, 1982–2002. Cancer Causes Control 17, 21–27 10.1007/s10552-005-3637-4 [DOI] [PubMed] [Google Scholar]
- Davies H., Bignell G. R., Cox C., Stephens P., Edkins S., Clegg S., et al. (2002). Mutations of the BRAF gene in human cancer. Nature 417, 949–954 10.1038/nature00766 [DOI] [PubMed] [Google Scholar]
- Edlundh-Rose E., Egyhazi S., Omholt K., Mansson-Brahme E., Platz A., Hansson J., et al. (2006). NRAS and BRAF mutations in melanoma tumours in relation to clinical characteristics: a study based on mutation screening by pyrosequencing. Melanoma Res. 16, 471–478 10.1097/01.cmr.0000232300.22032.86 [DOI] [PubMed] [Google Scholar]
- Falchook G. S., Lewis K. D., Infante J. R., Gordon M. S., Vogelzang N. J., DeMarini D. J., et al. (2012). Activity of the oral MEK inhibitor trametinib in patients with advanced melanoma: a phase 1 dose-escalation trial. Lancet Oncol. 13, 782–789 10.1016/S1470-2045(12)70269-3 [DOI] [PMC free article] [PubMed] [Google Scholar]
- Flaherty K. T., Puzanov I., Kim K. B., Ribas A., McArthur G. A., Sosman J. A., et al. (2010). Inhibition of mutated, activated BRAF in metastatic melanoma. N. Engl. J. Med. 363, 809–819 10.1056/NEJMoa1002011 [DOI] [PMC free article] [PubMed] [Google Scholar]
- Flaherty K. T., Robert C., Hersey P., Nathan P., Garbe C., Milhem M., et al. (2012). Improved survival with MEK inhibition in BRAF-mutated melanoma. N. Engl. J. Med. 367, 107–114 10.1056/NEJMoa1203421 [DOI] [PubMed] [Google Scholar]
- Friday B. B., Yu C., Dy G. K., Smith P. D., Wang L., Thibodeau S. N., et al. (2008). BRAF V600E disrupts AZD6244-induced abrogation of negative feedback pathways between extracellular signal-regulated kinase and Raf proteins. Cancer Res. 68, 6145–6153 10.1158/0008-5472.CAN-08-1430 [DOI] [PubMed] [Google Scholar]
- Hatzivassiliou G., Liu B., O'Brien C., Spoerke J. M., Hoeflich K. P., Haverty P. M., et al. (2012). ERK inhibition overcomes acquired resistance to MEK inhibitors. Mol. Cancer Ther. 11, 1143–1154 10.1158/1535-7163.MCT-11-1010 [DOI] [PubMed] [Google Scholar]
- Heidorn S. J., Milagre C., Whittaker S., Nourry A., Niculescu-Duvas I., Dhomen N., et al. (2010). Kinase-dead BRAF and oncogenic RAS cooperate to drive tumor progression through CRAF. Cell 140, 209–221 10.1016/j.cell.2009.12.040 [DOI] [PMC free article] [PubMed] [Google Scholar]
- Houben R., Becker J. C., Kappel A., Terheyden P., Brocker E. B., Goetz R., et al. (2004). Constitutive activation of the Ras-Raf signaling pathway in metastatic melanoma is associated with poor prognosis. J. Carcinog. 3, 6 10.1186/1477-3163-3-6 [DOI] [PMC free article] [PubMed] [Google Scholar]
- Johannessen C. M., Boehm J. S., Kim S. Y., Thomas S. R., Wardwell L., Johnson L. A., et al. (2010). COT drives resistance to RAF inhibition through MAP kinase pathway reactivation. Nature 468, 968–972 10.1038/nature09627 [DOI] [PMC free article] [PubMed] [Google Scholar]
- Kim J. E., Stones C., Joseph W. R., Leung E., Finlay G. J., Shelling A. N., et al. (2012). Comparison of growth factor signalling pathway utilisation in cultured normal melanocytes and melanoma cell lines. BMC Cancer 12:141 10.1186/1471-2407-12-141 [DOI] [PMC free article] [PubMed] [Google Scholar]
- Kumar P., Henikoff S., Ng P. C. (2009). Predicting the effects of coding non-synonymous variants on protein function using the SIFT algorithm. Nat. Protoc. 4, 1073–1081 10.1038/nprot.2009.86 [DOI] [PubMed] [Google Scholar]
- Liang J. J., Robinson E., Martin R. C. (2010). Cutaneous melanoma in New Zealand: 2000–2004. ANZ J. Surg. 80, 312–316 10.1111/j.1445-2197.2009.05199.x [DOI] [PubMed] [Google Scholar]
- Lis J. T., Schleif R. (1975). Size fractionation of double-stranded DNA by precipitation with polyethylene glycol. Nucleic Acids Res. 2, 383–389 10.1093/nar/2.3.383 [DOI] [PMC free article] [PubMed] [Google Scholar]
- Marshall E. S., Finlay G. J., Matthews J. H., Shaw J. H., Nixon J., Baguley B. C. (1992). Microculture-based chemosensitivity testing: a feasibility study comparing freshly explanted human melanoma cells with human melanoma cell lines. J. Natl. Cancer Inst. 84, 340–345 10.1093/jnci/84.5.340 [DOI] [PubMed] [Google Scholar]
- Marshall E. S., Matthews J. H., Shaw J. H., Nixon J., Tumewu P., Finlay G. J., et al. (1994). Radiosensitivity of new and established human melanoma cell lines: comparison of [3H]thymidine incorporation and soft agar clonogenic assays. Eur. J. Cancer 30A, 1370–1376 [DOI] [PubMed] [Google Scholar]
- Pritchard C., Carragher L., Aldridge V., Giblett S., Jin H., Foster C., et al. (2007). Mouse models for BRAF-induced cancers. Biochem. Soc. Trans. 35, 1329–1333 10.1042/BST0351329 [DOI] [PMC free article] [PubMed] [Google Scholar]
- Sebolt-Leopold J. S. (2004). MEK inhibitors: a therapeutic approach to targeting the Ras-MAP kinase pathway in tumors. Curr. Pharm. Des. 10, 1907–1914 10.2174/1381612043384439 [DOI] [PubMed] [Google Scholar]
- Smalley K. S., Flaherty K. T. (2009). Integrating BRAF/MEK inhibitors into combination therapy for melanoma. Br. J. Cancer 100, 431–435 10.1038/sj.bjc.6604891 [DOI] [PMC free article] [PubMed] [Google Scholar]
- Solit D. B., Garraway L. A., Pratilas C. A., Sawai A., Getz G., Basso A., et al. (2006). BRAF mutation predicts sensitivity to MEK inhibition. Nature 439, 358–362 10.1038/nature04304 [DOI] [PMC free article] [PubMed] [Google Scholar]
- Thomas R. K., Baker A. C., Debiasi R. M., Winckler W., Laframboise T., Lin W. M., et al. (2007). High-throughput oncogene mutation profiling in human cancer. Nat. Genet. 39, 347–351 10.1038/ng1975 [DOI] [PubMed] [Google Scholar]
- Wee S., Jagani Z., Xiang K. X., Loo A., Dorsch M., Yao Y. M., et al. (2009). PI3K pathway activation mediates resistance to MEK inhibitors in KRAS mutant cancers. Cancer Res. 69, 4286–4293 10.1158/0008-5472.CAN-08-4765 [DOI] [PubMed] [Google Scholar]