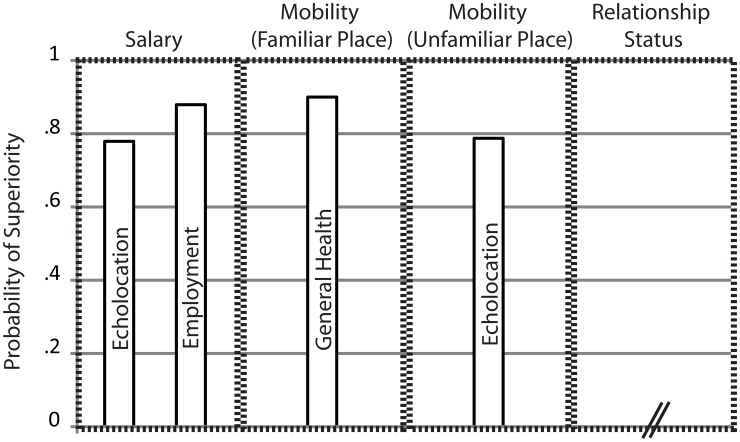
Figure 1.
Summary of Results. Bars indicate non-parametric measures of effect-size, i.e., Probability of Superiority as suggested by Grissom and Kim (2012), for those predictors for which both linear regression coefficients and non-parametric tests were significant. Predictors are listed separately for variables “Salary,” “Mobility in Familiar Places,” “Mobility in Unfamiliar Places,” and “Relationship Status.” For the variable “Relationship Status” no predictor contributed significantly. For the other variables names of significant predictors are inscribed within each bar. Probability of Superiority estimates the probability that a score randomly drawn from one population will be greater than a score randomly drawn from another population. For example, Probability of Superiority of 0.78 for predictor “Echolocation” for variable “Salary” means that the probability that a randomly drawn salary score from an echolocating population will be greater than a randomly drawn salary score from a non-echolocating population is 0.78.

