
Figure 4.
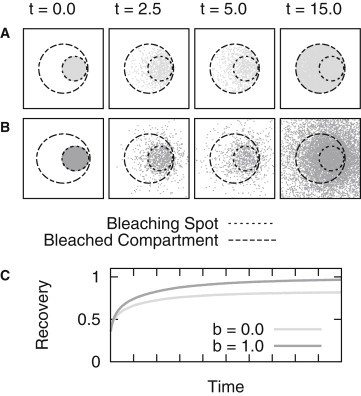
Influence of the chosen boundary condition on the FRAP recovery curve. Results are shown for simulations in a circular geometry with a bleaching spot positioned at the edge of the domain. (A, upper panel) Distributions of bleached particles considering a no-flow boundary are depicted (parameter set IIA1). (B, lower panel) Here, the no-flow boundary condition was omitted (parameter set IIA2). (C) Corresponding recovery curves.